Results
What it finds on the four sample clips
Pick a clip. The timeline has one lane per class; click a segment to jump the video there. The risk curve under it is Part B, and it follows the playhead. Switch to "Our labels" to compare with our dev labels (how we made them is on the report page).
The video did not load. The timeline and table below still work.
vehiclepersonbicyclein an event we submit, coloured by class and namedU-turn we find but do not submitThe strip burned in under the picture shows the submitted events and the risk (red line). Blue outlines are the crossings, the red line across the lanes is the SB stop line.
| Start | End | Length | Class | Zone | Note and actors | Best IoU with a label |
|---|
Could not load the results for this clip.
Per-class F1 on our dev labels
From evaluate.py --json. Predicted and labelled segments of a class are matched one to one by temporal IoU at 0.3, 0.5 and 0.7. Score A is the mean over classes of the mean F1 over the three thresholds; a class counts if it is in the labels or the predictions.
Part B is not scored here: evaluate.py returns null when the labels contain no accident, and none of the four sample clips has one.
| Class | F1 @0.3 | F1 @0.5 | F1 @0.7 | Mean F1 | TP / FP / FN @0.5 |
|---|---|---|---|---|---|
| Red light emitted | 0.67 | 0.67 | 0.67 | 0.67 | 1 / 0 / 1 |
| Illegal U-turn rule off | 0.00 | 0.00 | 0.00 | 0.00 | 0 / 0 / 9 |
| Stopped vehicle emitted | 1.00 | 0.86 | 0.86 | 0.90 | 6 / 1 / 1 |
| Jaywalking emitted | 0.81 | 0.46 | 0.35 | 0.54 | 12 / 12 / 16 |
| Failure to yield emitted | 0.57 | 0.51 | 0.43 | 0.50 | 24 / 28 / 18 |
| Illegal turn no rule | 0.00 | 0.00 | 0.00 | 0.00 | 0 / 0 / 2 |
| Stop line emitted | 0.77 | 0.77 | 0.77 | 0.77 | 5 / 3 / 0 |
| Congestion emitted | 0.80 | 0.80 | 0.80 | 0.80 | 2 / 0 / 1 |
Illegal U-turn scores 0.00 because we do not submit it. Our U-turn rule finds them with a mean F1 of 0.27 on these labels (0.47, 0.24, 0.12 at IoU 0.3, 0.5 and 0.7), and the annotated videos show them in purple. We leave the class out because nothing in view says a U-turn is prohibited here, so we cannot tell whether the organisers' annotators count them as illegal.
Which class we predict for each labelled event
For each event in our labels, the class of the predicted event that overlaps it most in time, if their temporal IoU is at least 0.3; otherwise it counts as missed. The last row counts predictions that overlap no label that well. Of the 87 labelled events in classes we emit, 4 get another class, 21 are missed and 26 predictions match no label: our errors are misses and false alarms, much more than one class read as another.
| Labelled predicted | RED | SV | JAY | FTY | STOP | CONG | Missed |
|---|---|---|---|---|---|---|---|
| Red lightRED 2 | 1 | . | . | . | . | . | 1 |
| Stopped vehicleSV 7 | . | 7 | . | . | . | . | . |
| JaywalkingJAY 28 | . | . | 20 | 1 | 1 | . | 6 |
| Failure to yieldFTY 42 | . | . | 1 | 27 | . | . | 14 |
| Stop lineSTOP 5 | . | . | . | . | 5 | . | . |
| CongestionCONG 3 | . | . | 1 | . | . | 2 | . |
| Illegal U-turnUT 9 | . | 1 | 2 | 1 | 1 | 1 | 3 |
| Illegal turnIT 2 | . | . | 1 | . | . | . | 1 |
| No label (false alarm)None 26 | . | . | 3 | 22 | 1 | . |
Codes: RED red light, SV stopped vehicle, JAY jaywalking, FTY failure to yield, STOP stop line, CONG congestion, UT illegal U-turn, IT illegal turn; None is no label. It checks overlap in time only, so a labelled U-turn that happens while someone jaywalks counts as jaywalking. It uses IoU 0.3 and is not one-to-one like evaluate.py, so the diagonal is higher than the TP at 0.5 in the table above. U-turns (rule off) and illegal turns (no rule) are in our labels but not in our submission, so theirs are all missed or overlap other events.
Examples of each class we find
Up to three per class and clip, the longest ones. Each card opens the clip at that moment in the player above.
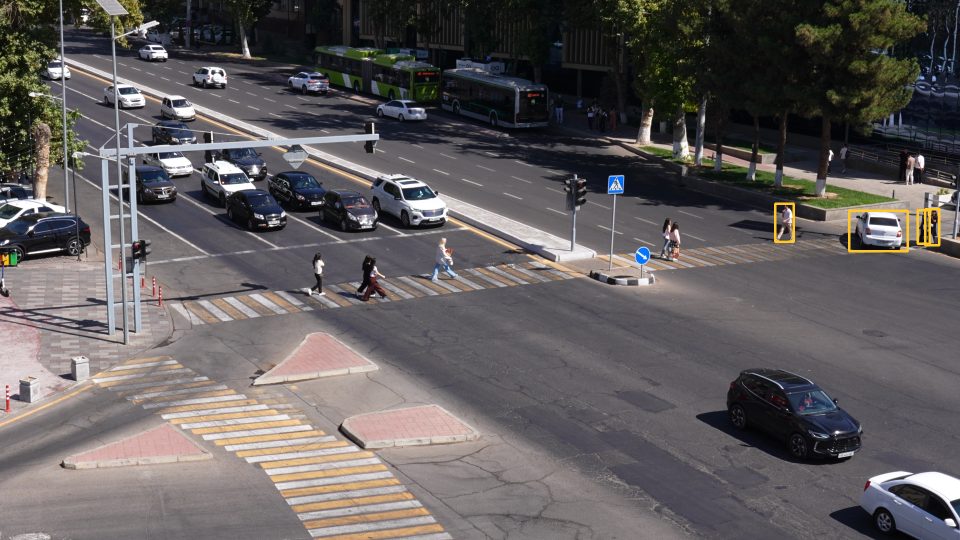 Failure to yieldC3896 at 0:00.0north crossing, NB half
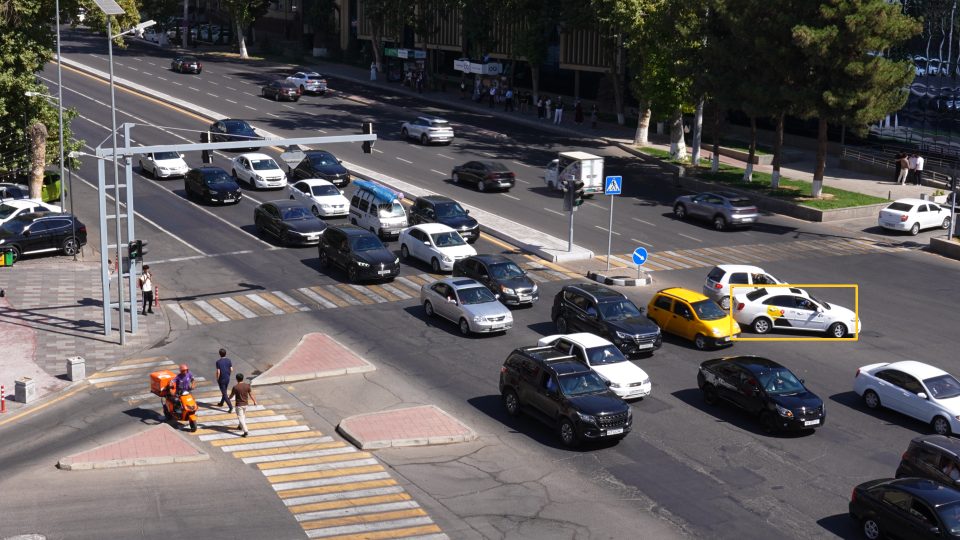 Illegal U-turnC3896 at 0:34.9U-turn round the median nose
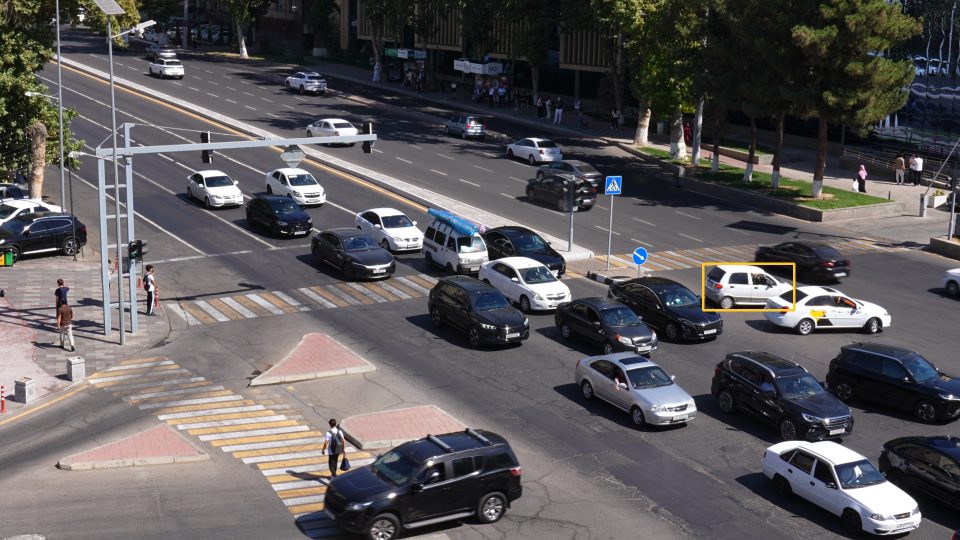 Illegal U-turnC3896 at 0:37.1U-turn round the median nose
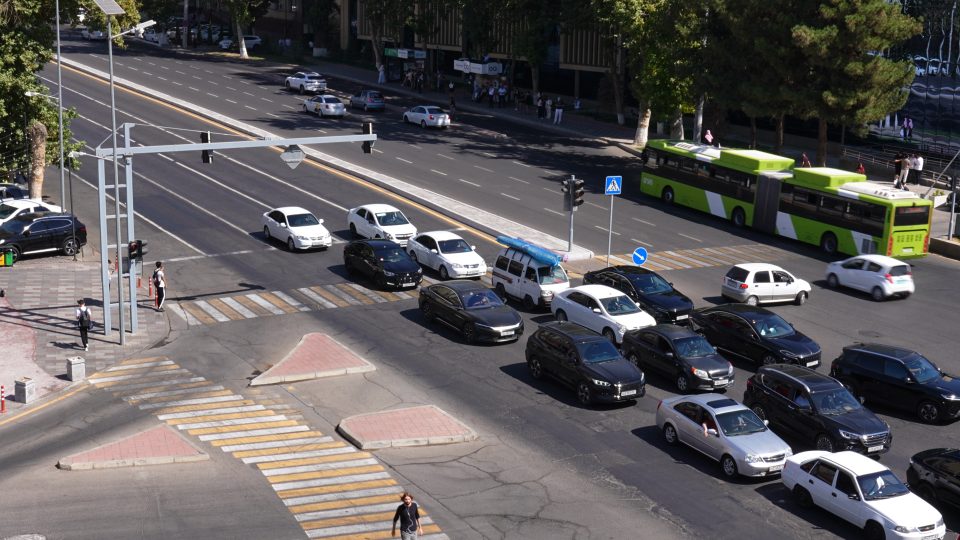 CongestionC3896 at 0:57.5max 13 standing
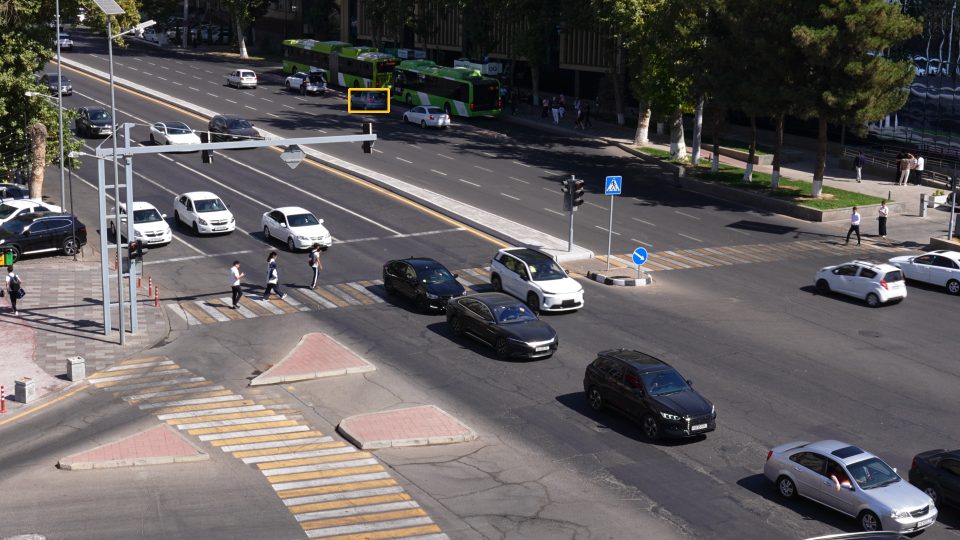 Stopped vehicleC3896 at 0:59.7NB lane
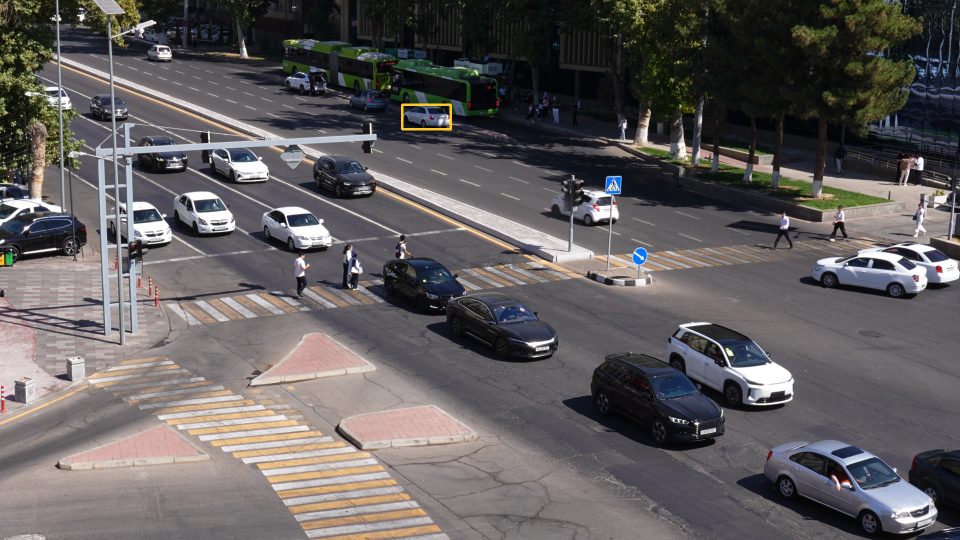 Stopped vehicleC3896 at 0:58.6NB lane
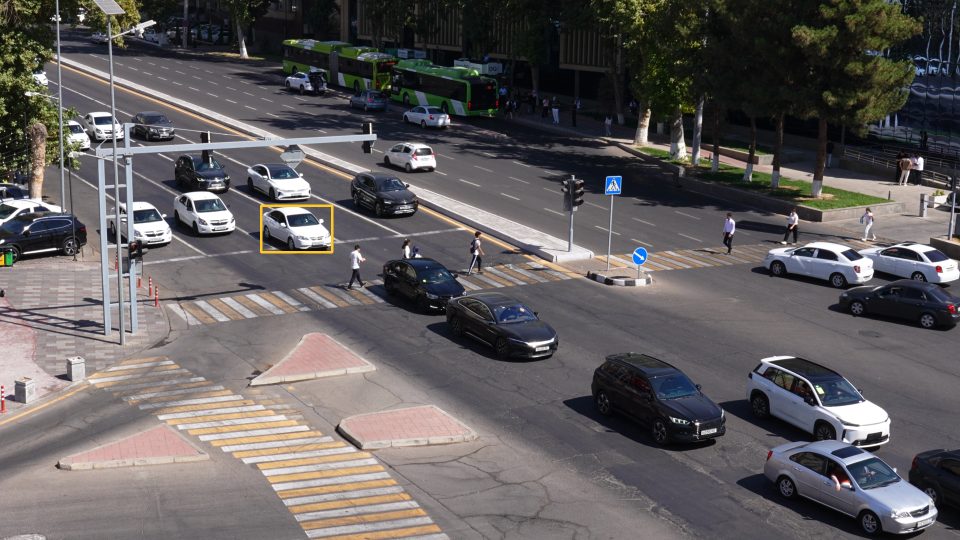 Stop lineC3896 at 1:06.1near the stop line
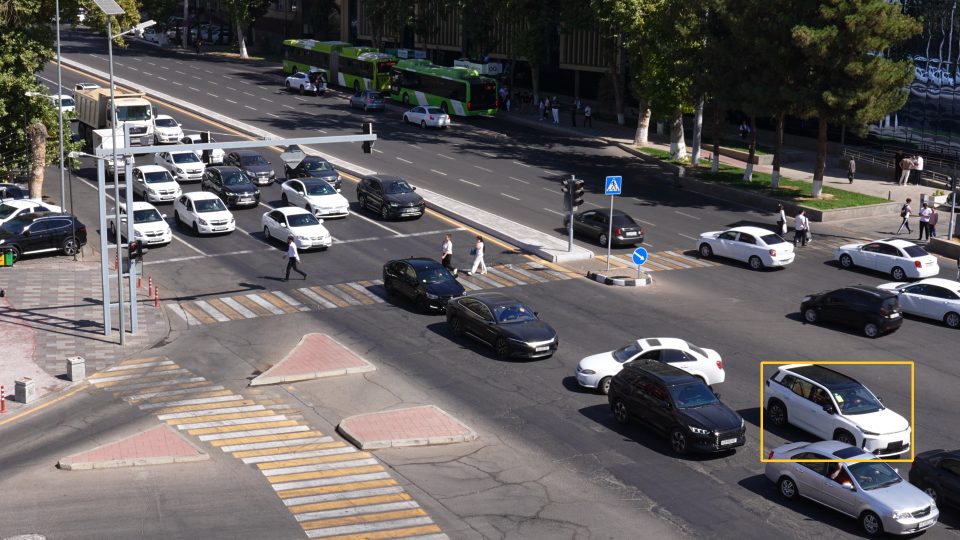 Red lightC3896 at 1:18.9red for 12.8s
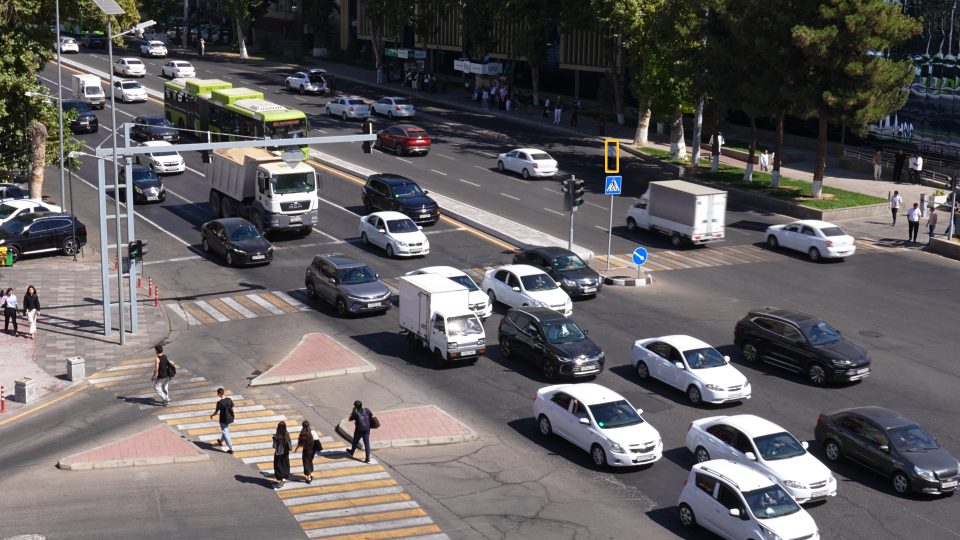 JaywalkingC3896 at 1:48.9near the NB carriageway
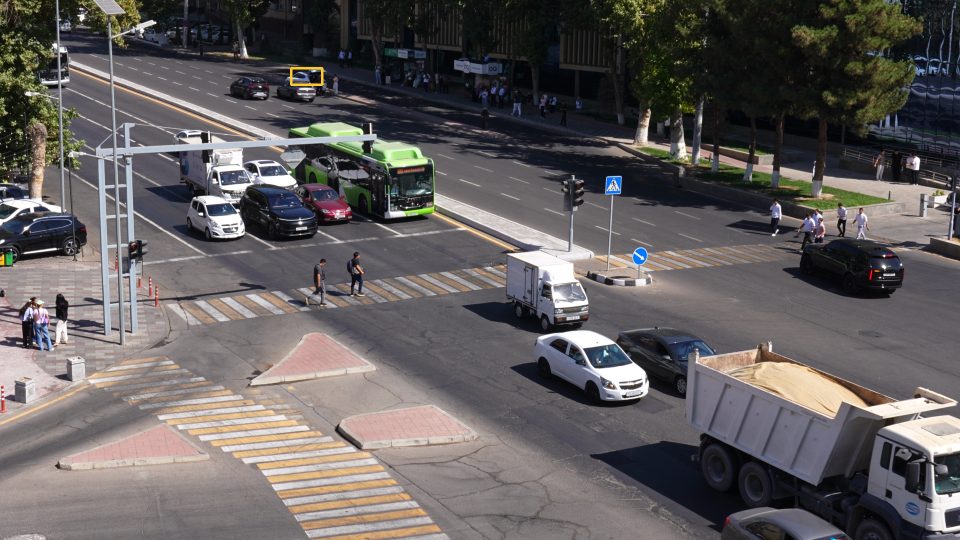 Stopped vehicleC3896 at 0:00.0NB lane
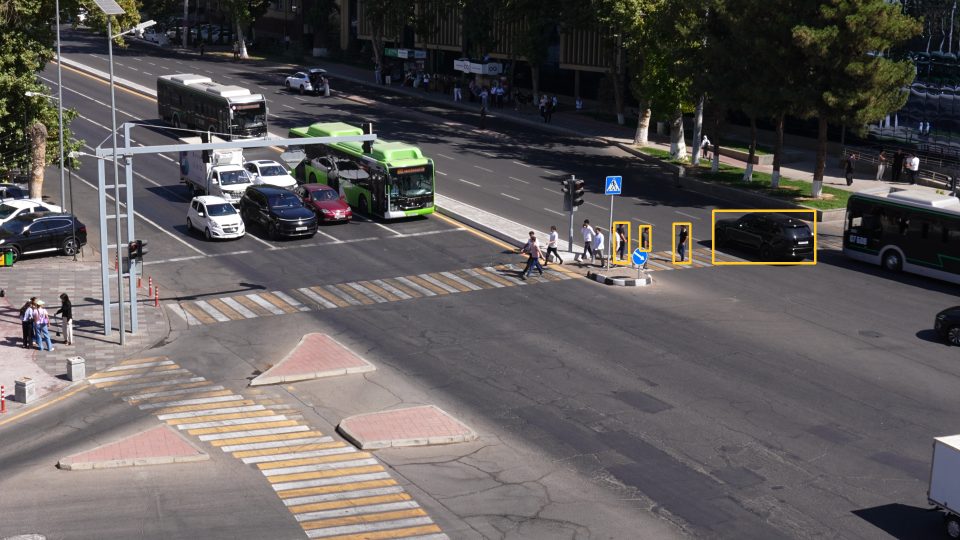 Failure to yieldC3896 at 2:35.8north crossing, NB half
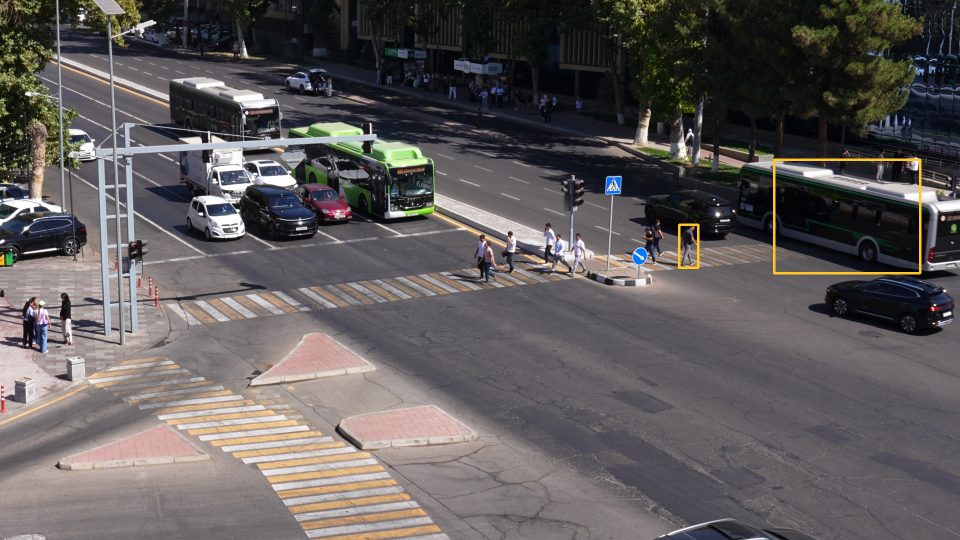 Failure to yieldC3896 at 2:37.1north crossing, NB half
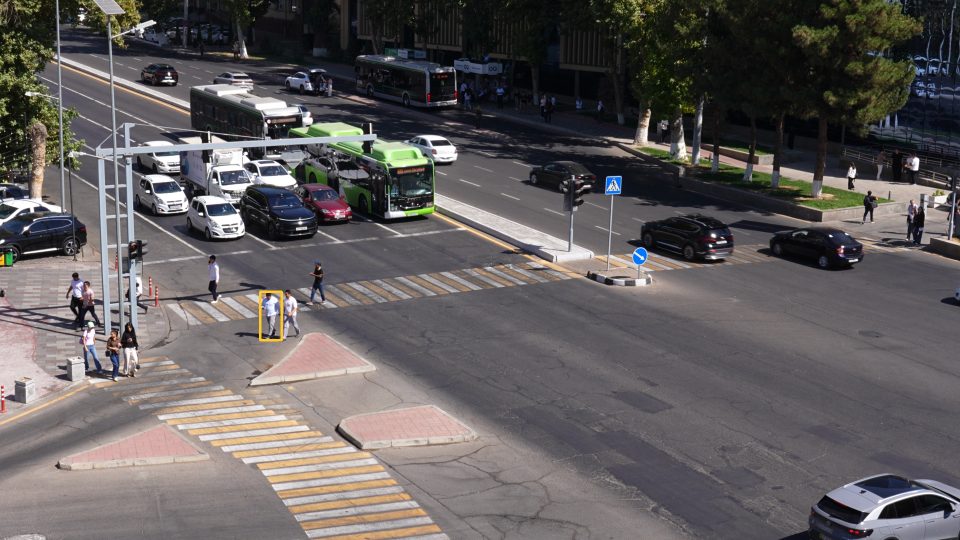 JaywalkingC3896 at 2:43.1near the north crossing
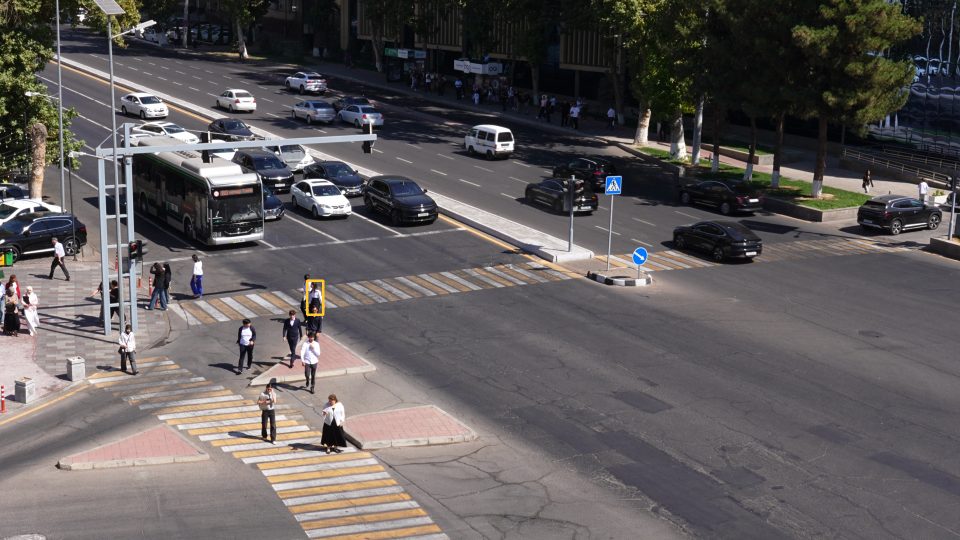 JaywalkingC3896 at 3:59.6near the north crossing
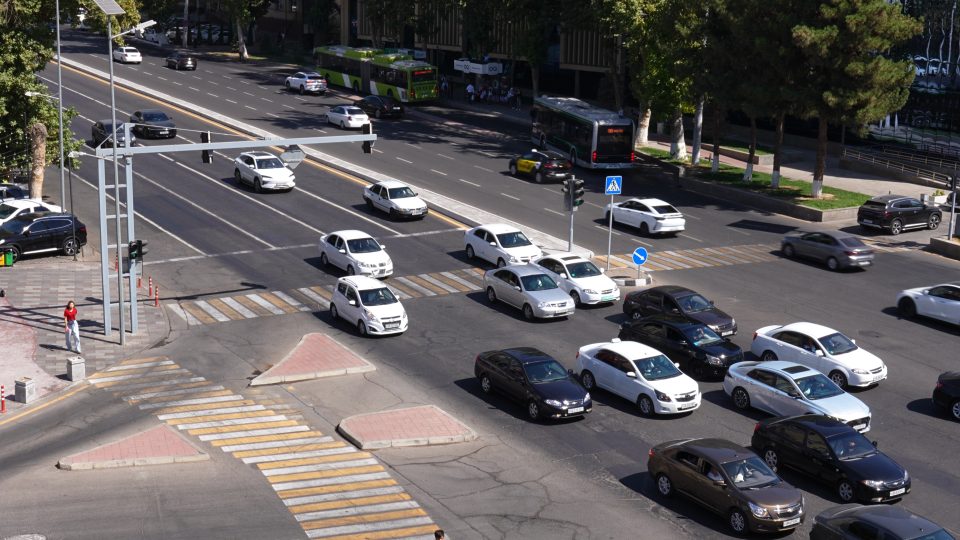 CongestionC3896 at 4:34.5max 7 standing
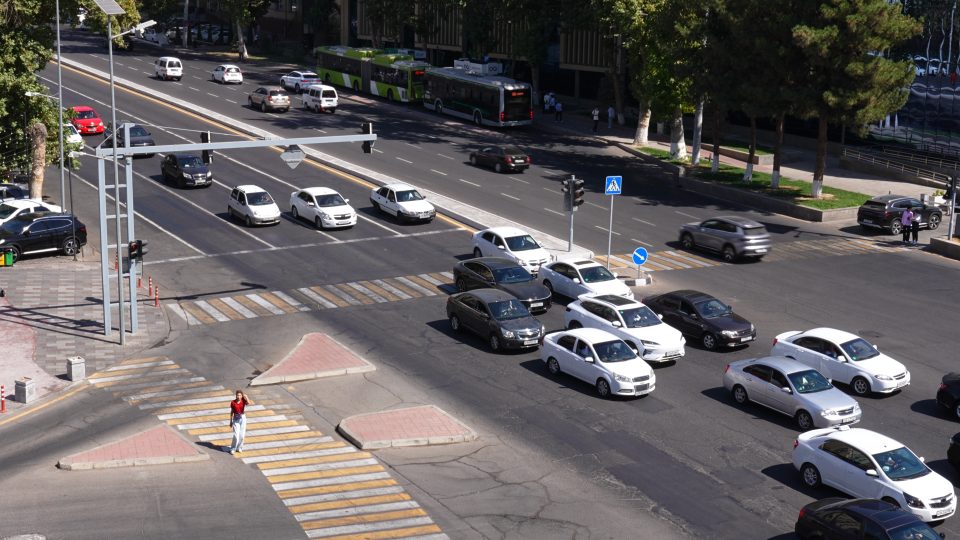 CongestionC3896 at 4:47.0max 13 standing
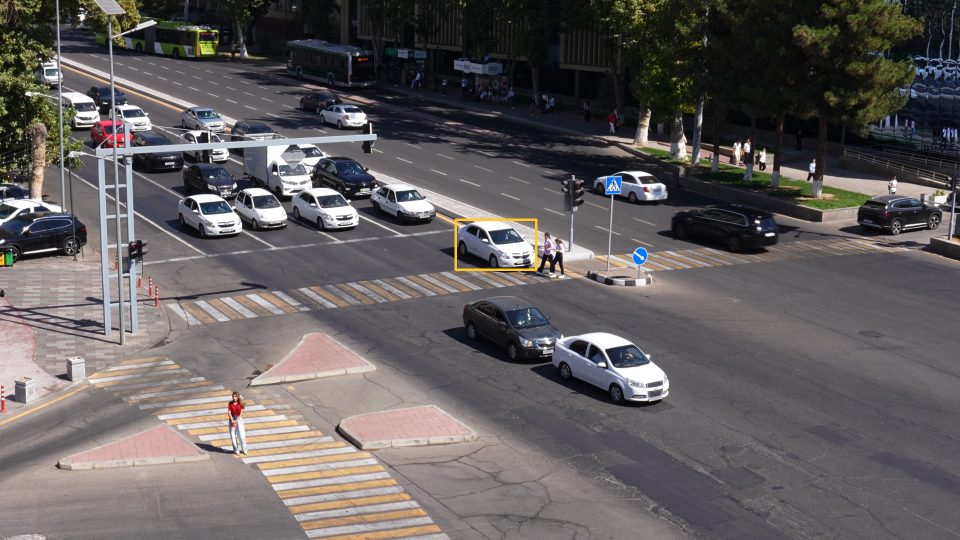 Stop lineC3896 at 4:51.3near the stop line
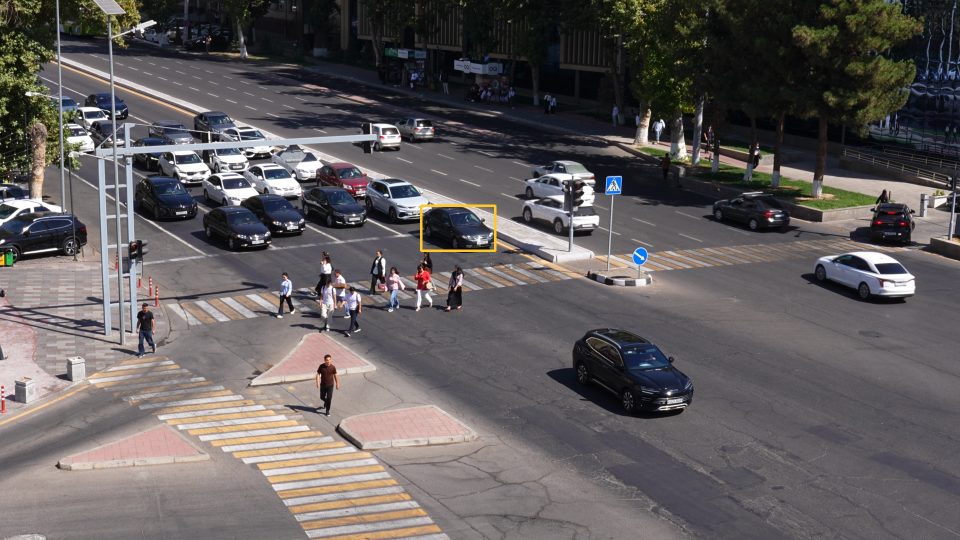 Stop lineC3897 at 0:00.0near the stop line
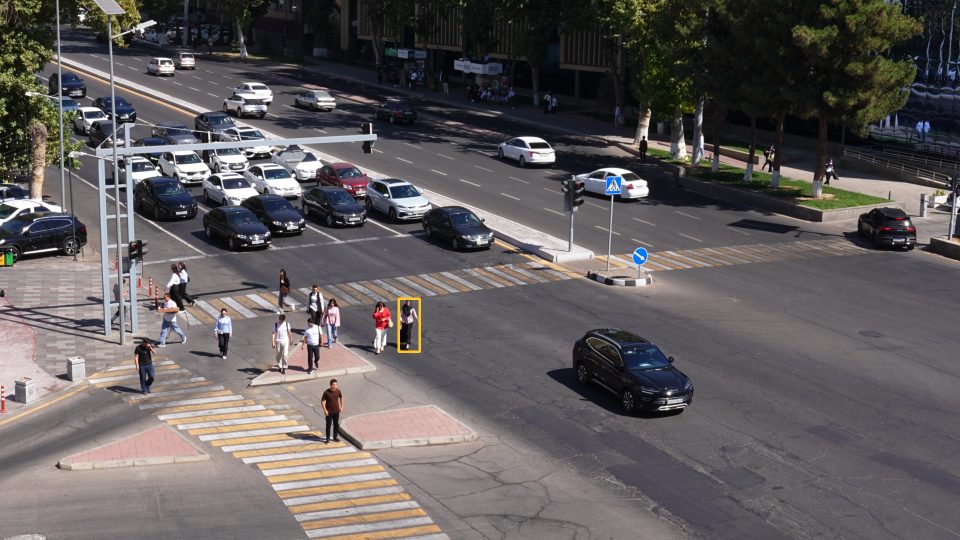 JaywalkingC3897 at 0:05.8near the north crossing
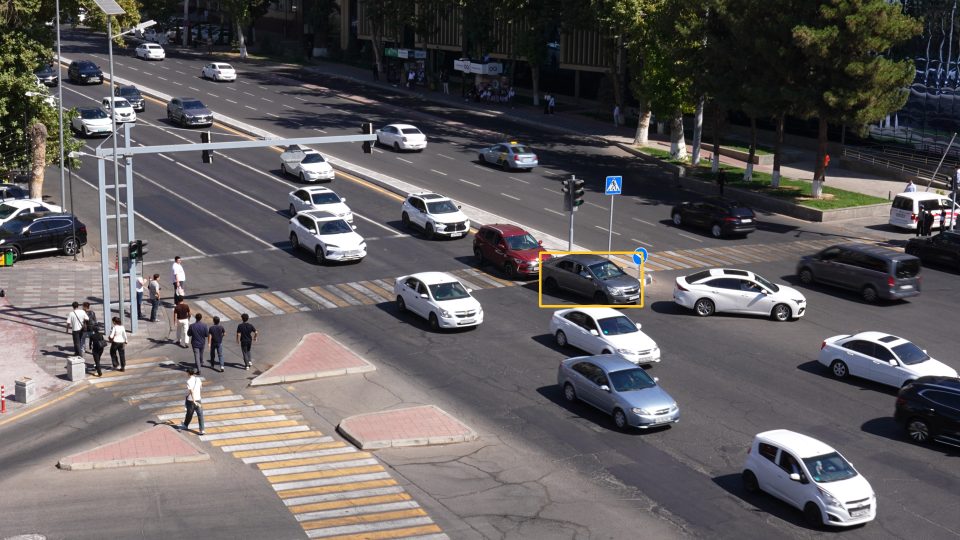 Illegal U-turnC3897 at 0:08.2U-turn round the median nose
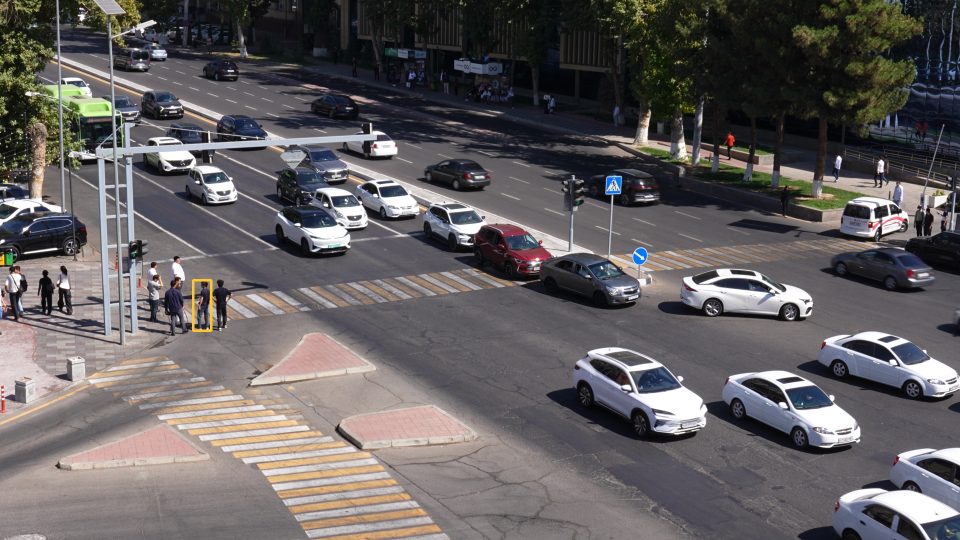 JaywalkingC3897 at 0:39.0near the stop line
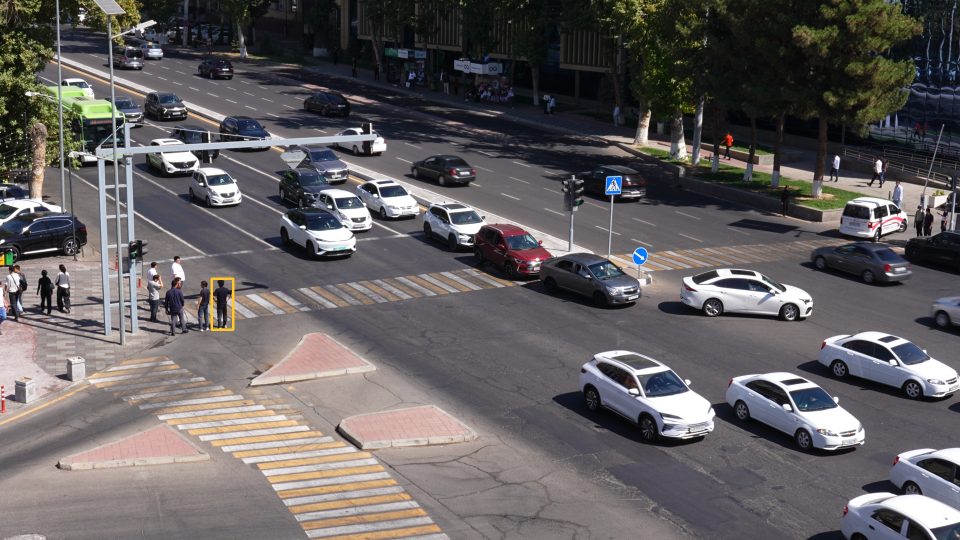 JaywalkingC3897 at 0:40.8near the stop line
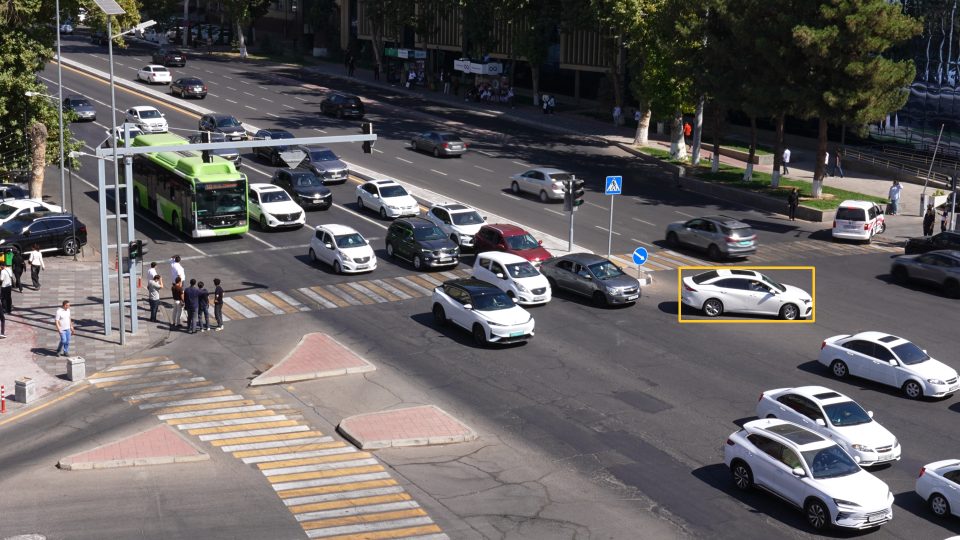 Illegal U-turnC3897 at 0:36.0U-turn round the median nose
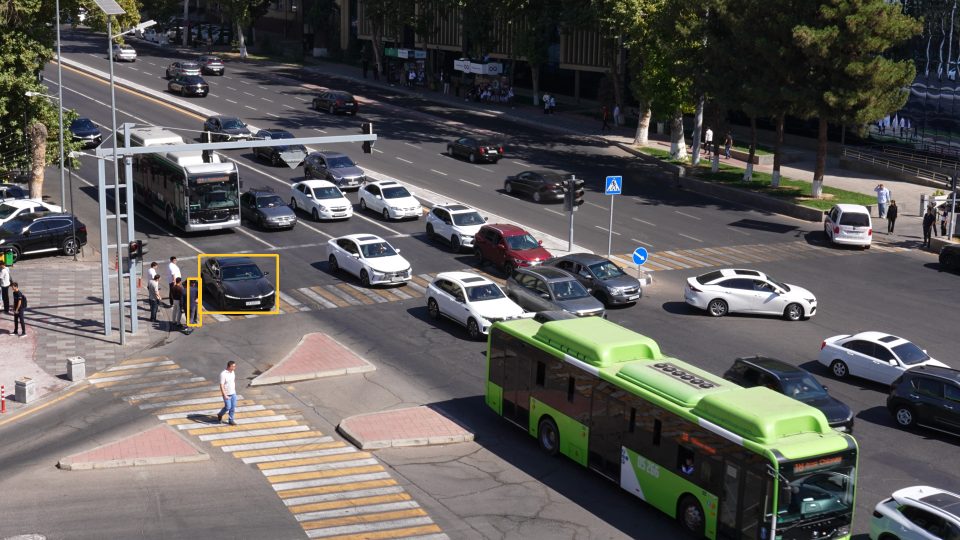 Failure to yieldC3897 at 0:55.4north crossing, SB half
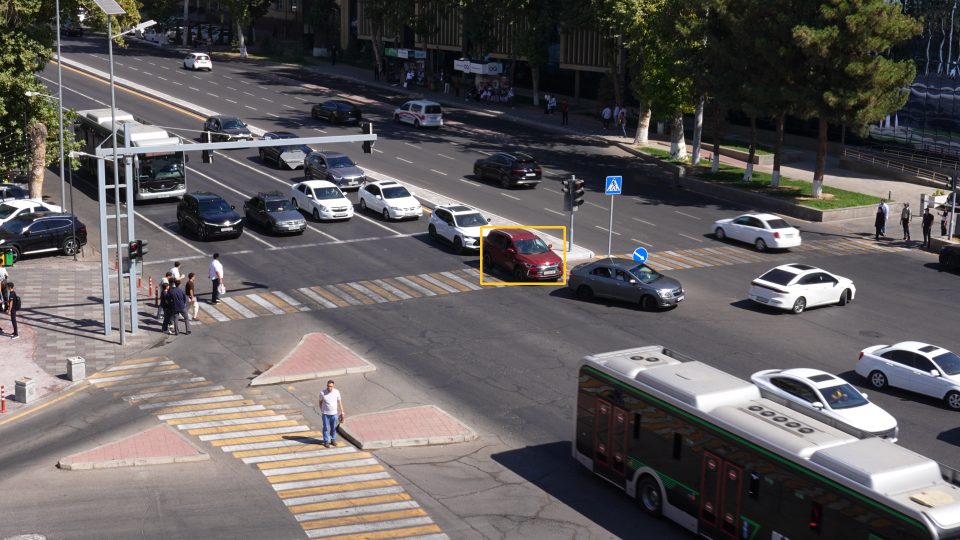 Stop lineC3897 at 0:58.8near the stop line
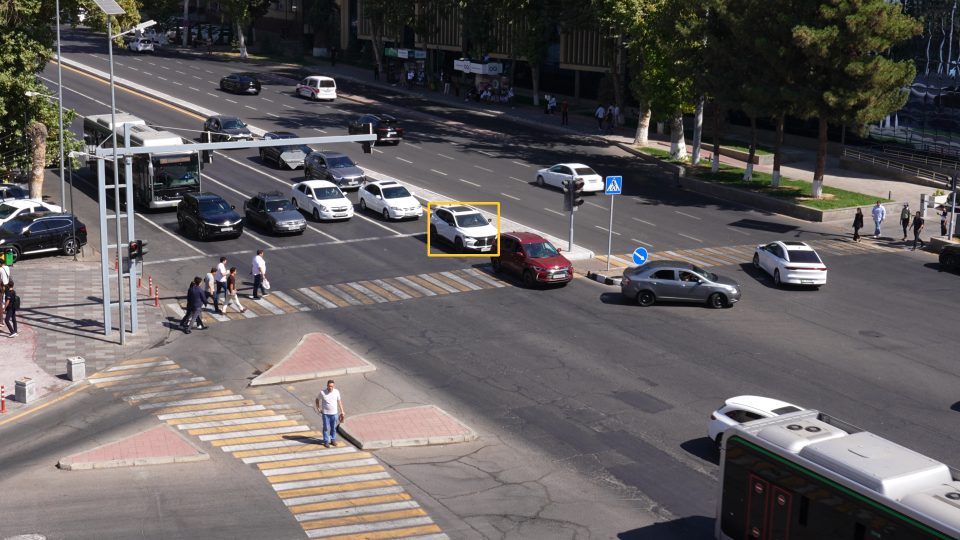 Stop lineC3897 at 0:58.8near the stop line
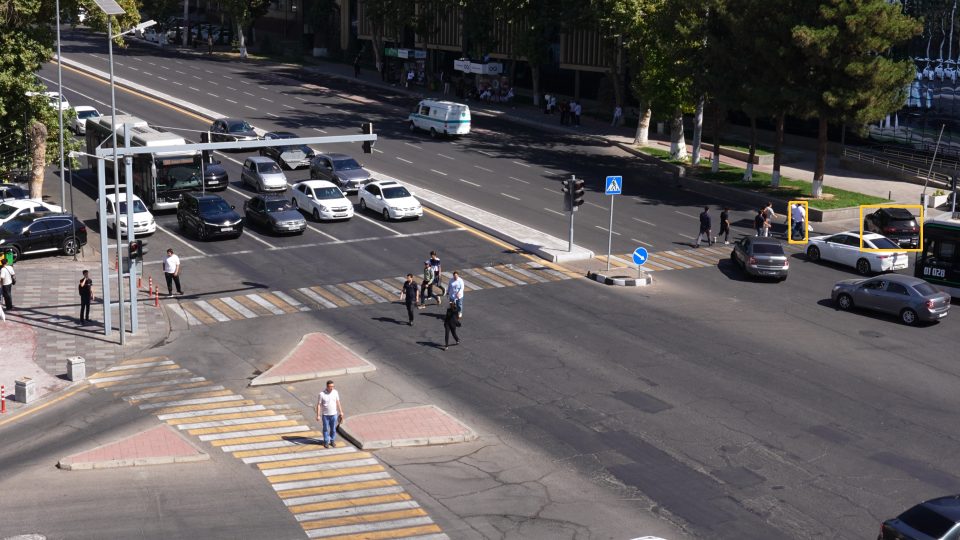 Failure to yieldC3897 at 1:20.0north crossing, NB half
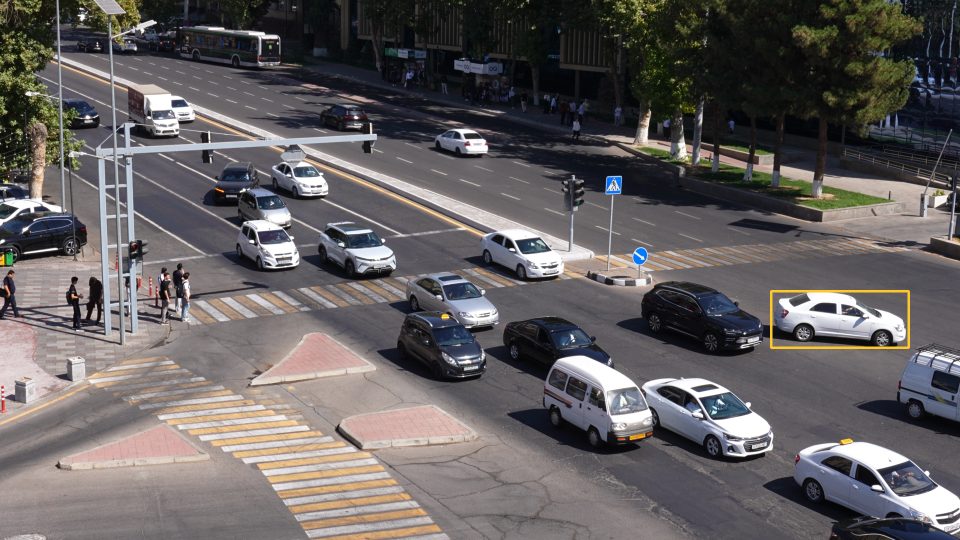 Illegal U-turnC3897 at 2:00.3U-turn round the median nose
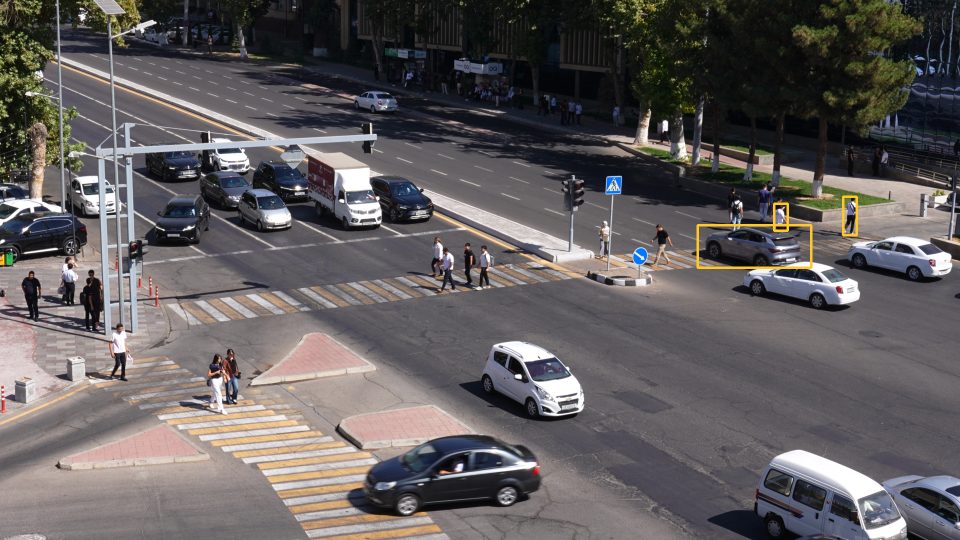 Failure to yieldC3897 at 2:36.6north crossing, NB half
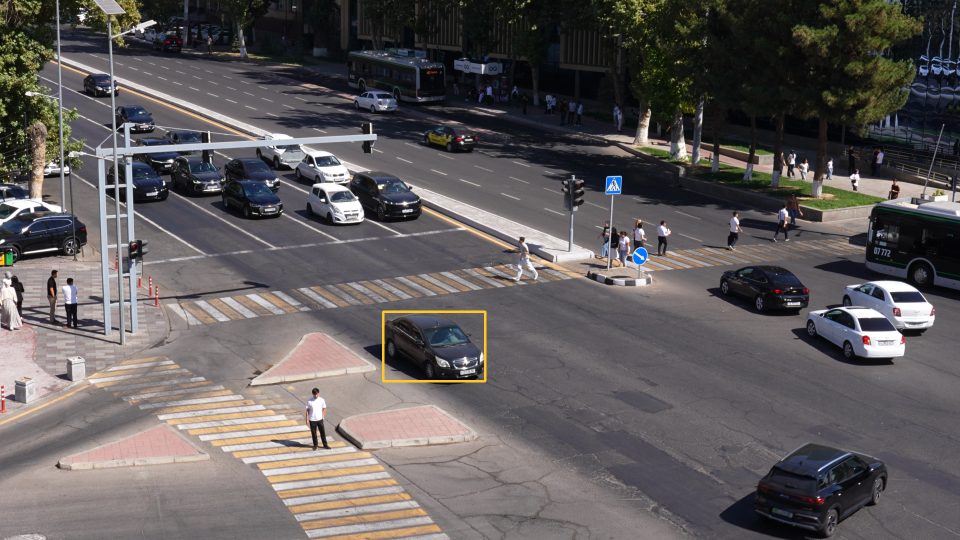 Stopped vehicleC3897 at 3:29.8junction box
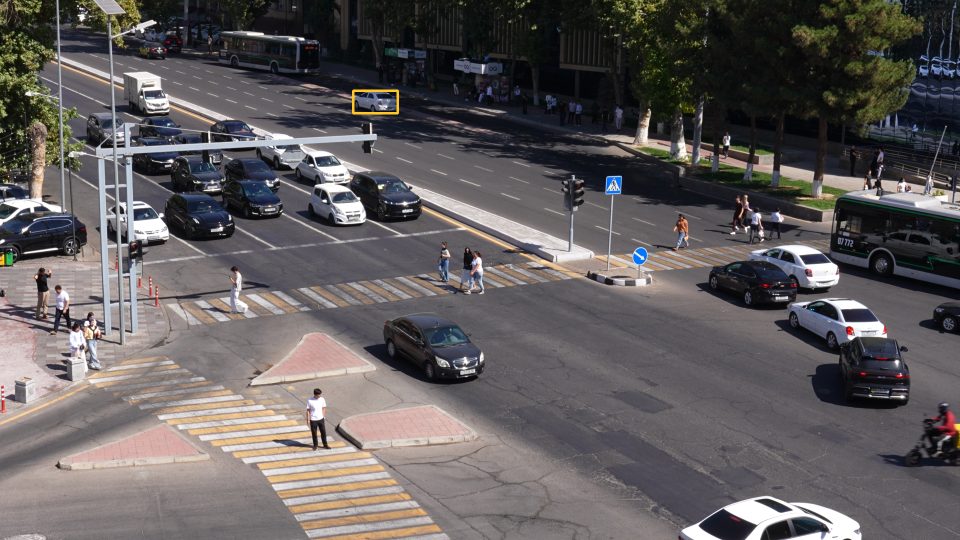 Stopped vehicleC3897 at 2:29.5NB lane
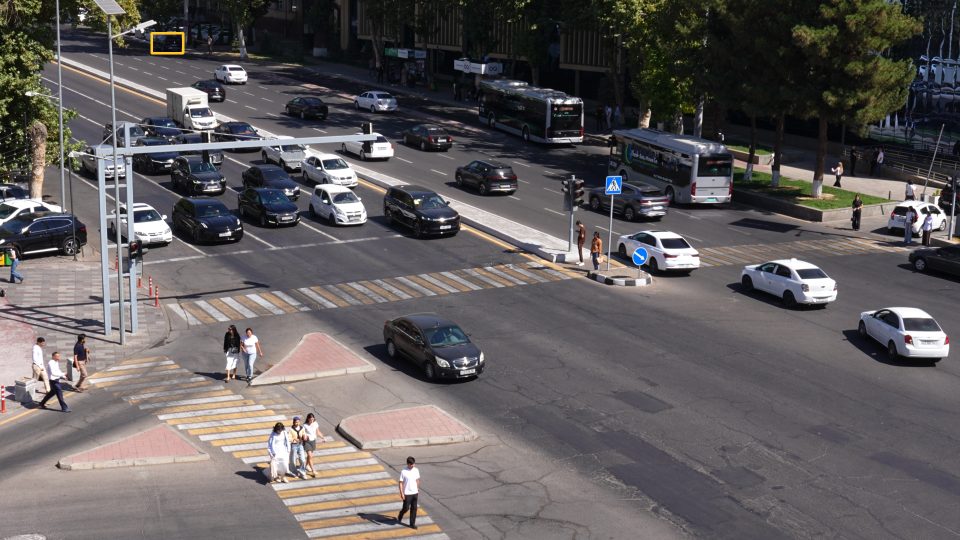 Stopped vehicleC3897 at 3:38.5NB lane
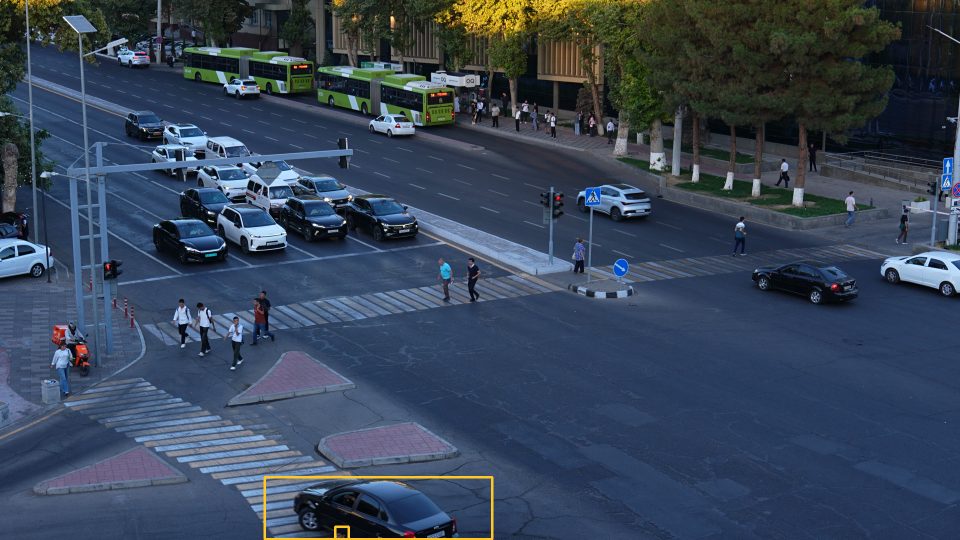 Failure to yieldC3902 at 0:24.1west crossing
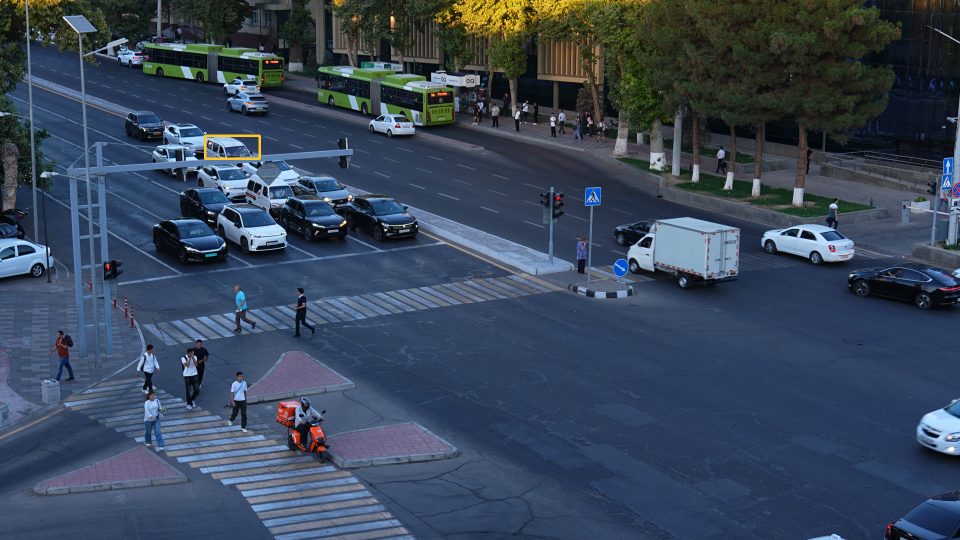 Illegal U-turnC3902 at 0:01.3U-turn round the median nose
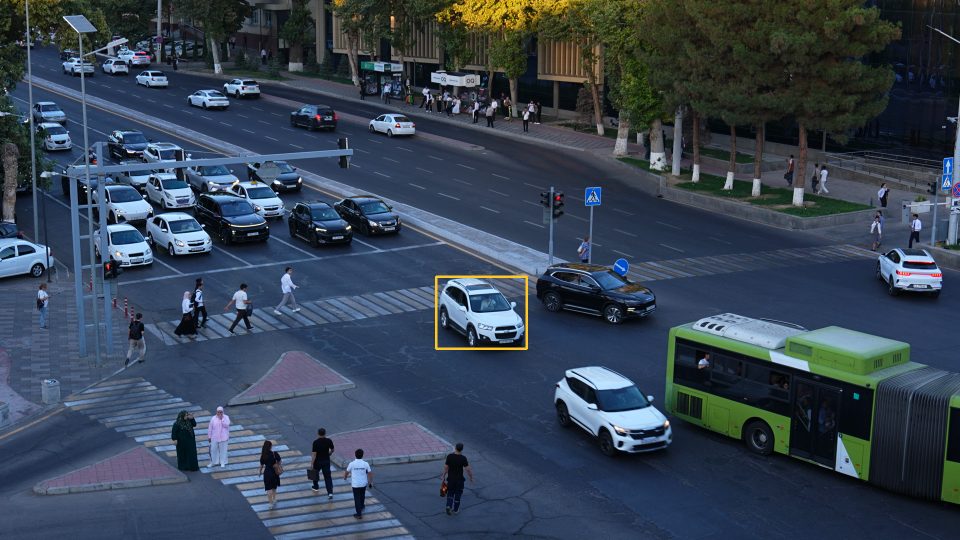 Stop lineC3902 at 1:18.9near the stop line
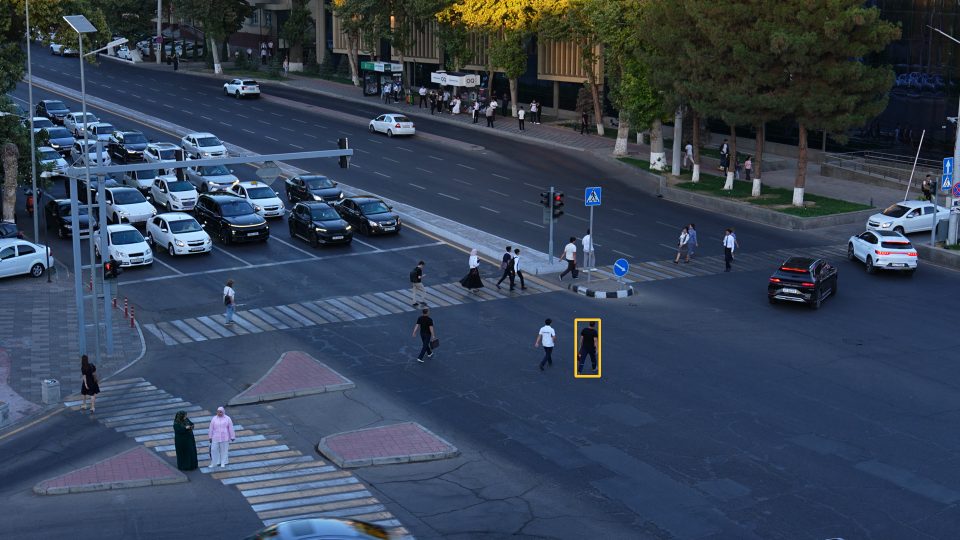 JaywalkingC3902 at 1:20.4near the junction box
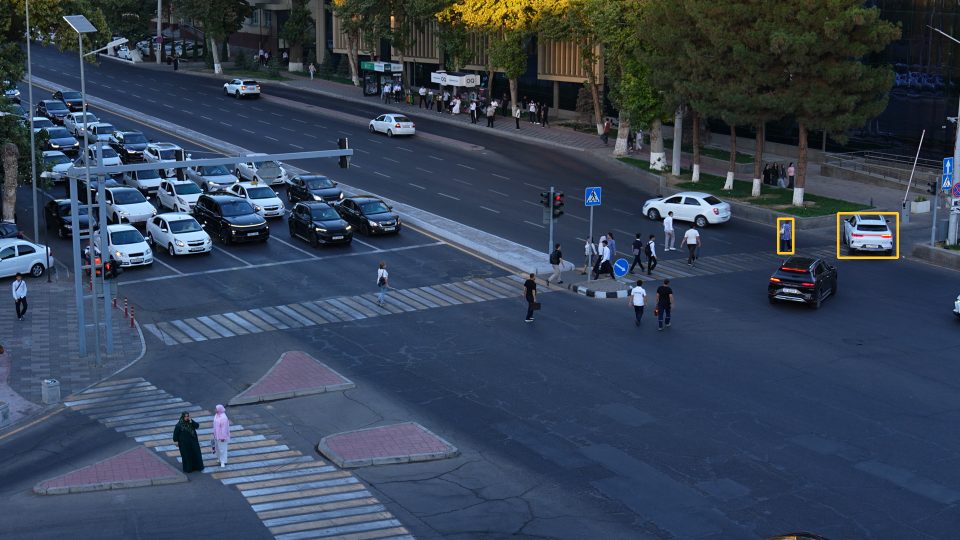 Failure to yieldC3902 at 1:32.7north crossing, NB half
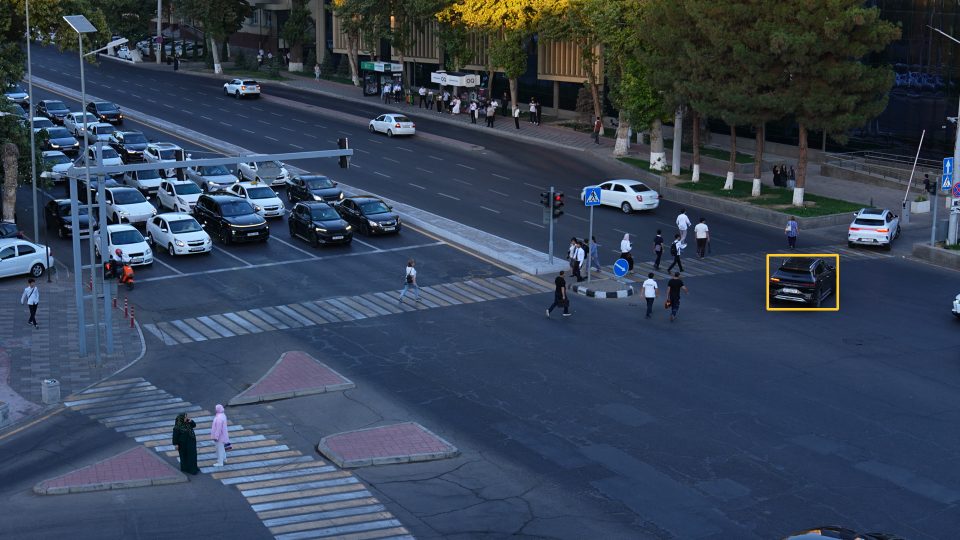 Illegal U-turnC3902 at 1:23.6U-turn round the median nose
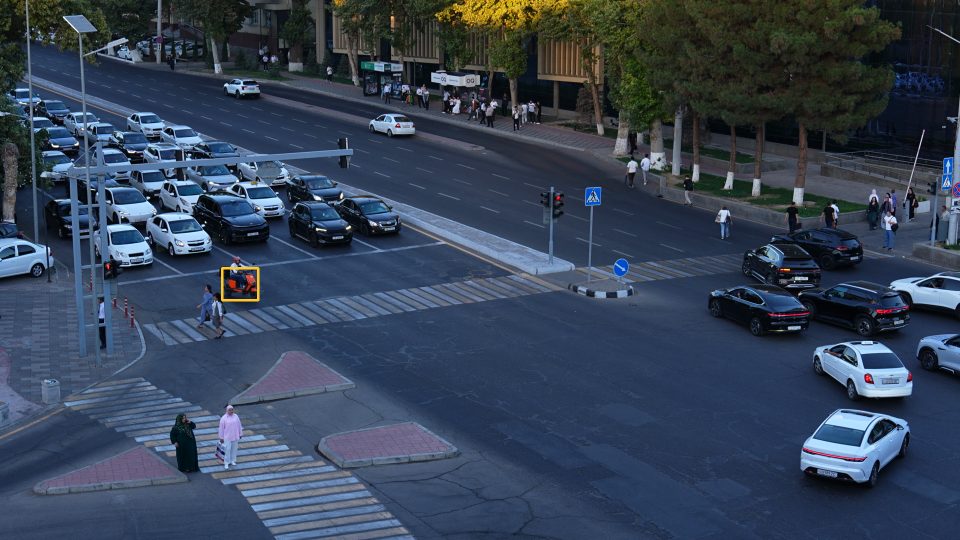 Stop lineC3902 at 1:40.0near the stop line
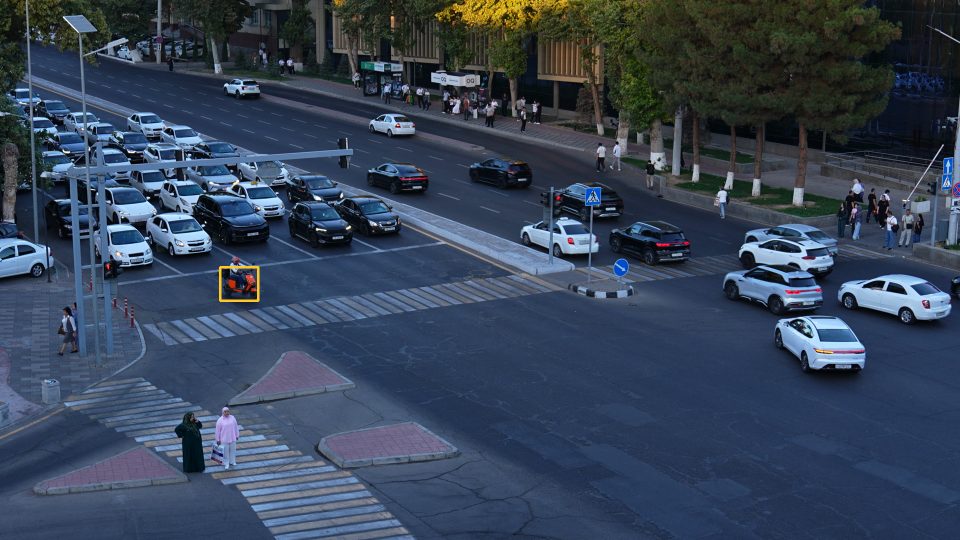 Stop lineC3902 at 1:48.2near the stop line
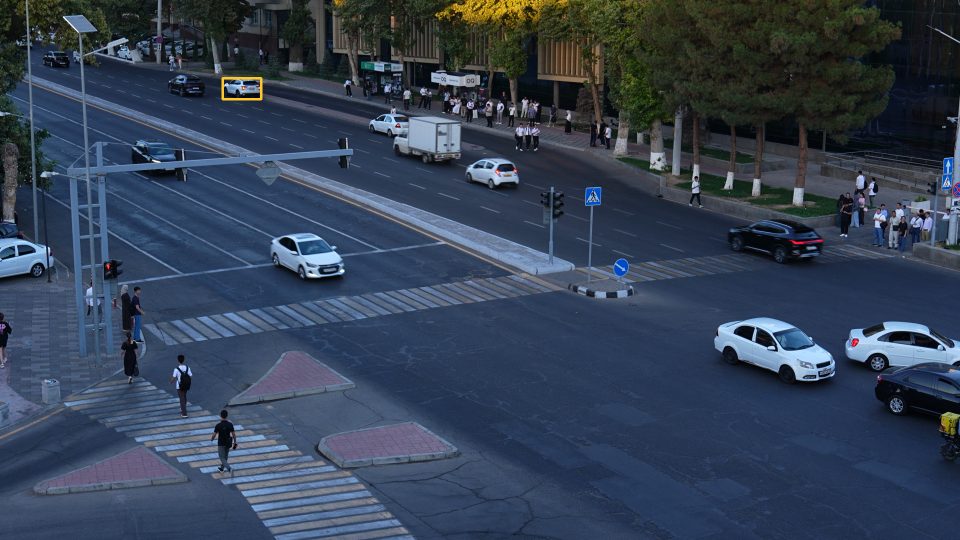 Stopped vehicleC3902 at 0:00.6NB lane
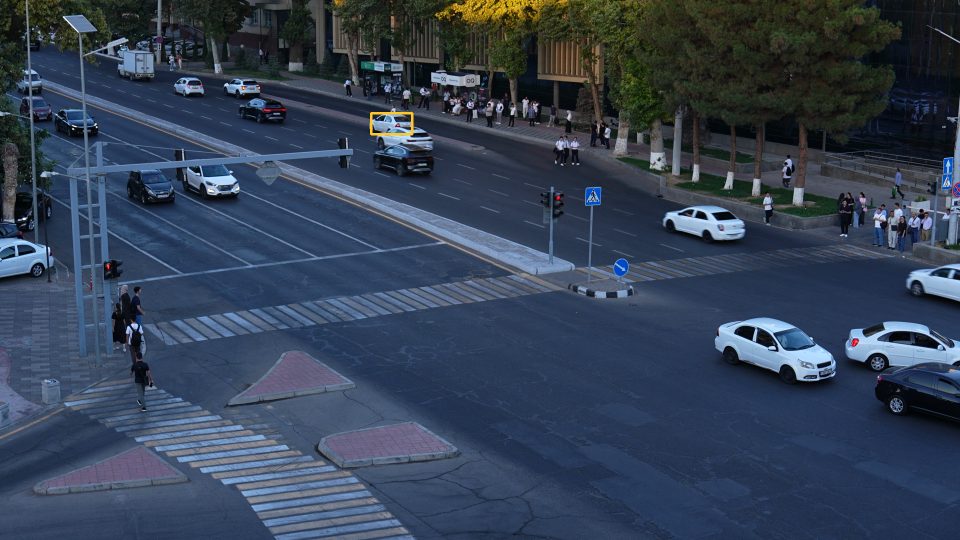 Stopped vehicleC3902 at 0:00.0NB lane
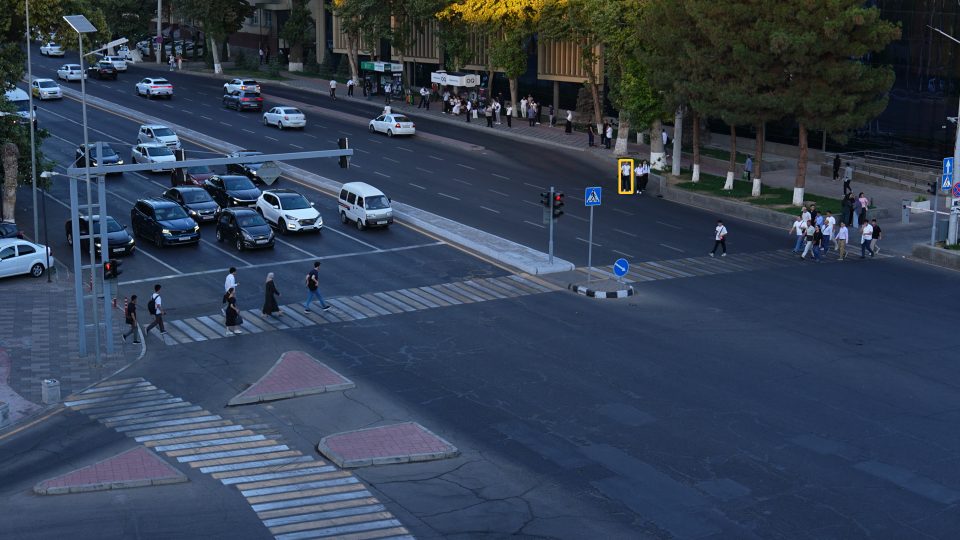 JaywalkingC3902 at 2:39.0near the NB carriageway
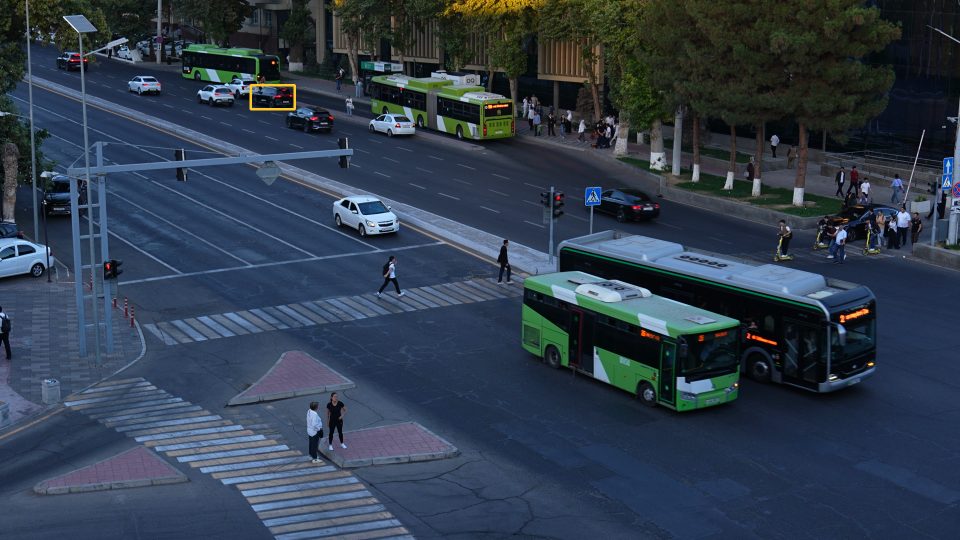 Stopped vehicleC3902 at 3:50.2NB lane
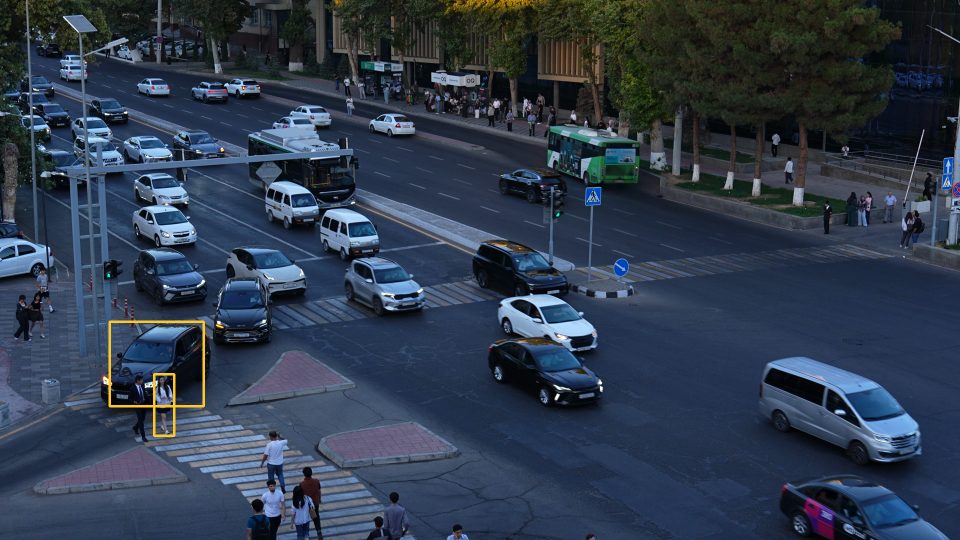 Failure to yieldC3902 at 4:44.6west crossing
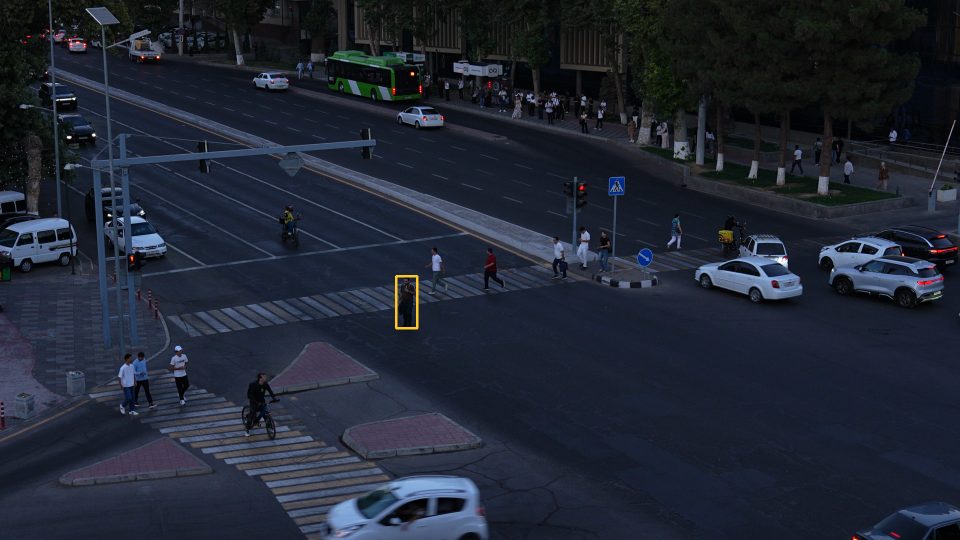 JaywalkingC3905 at 0:11.0near the north crossing
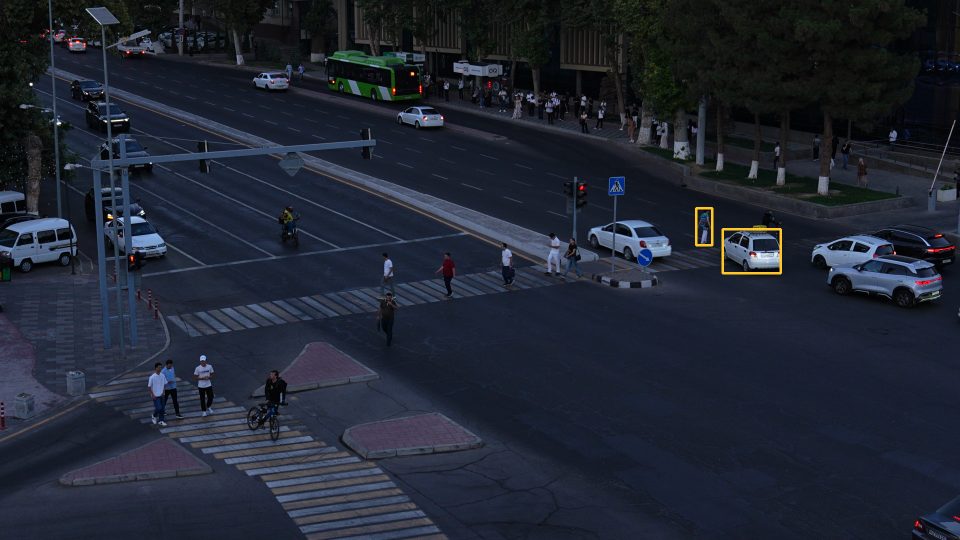 Failure to yieldC3905 at 0:13.4north crossing, NB half
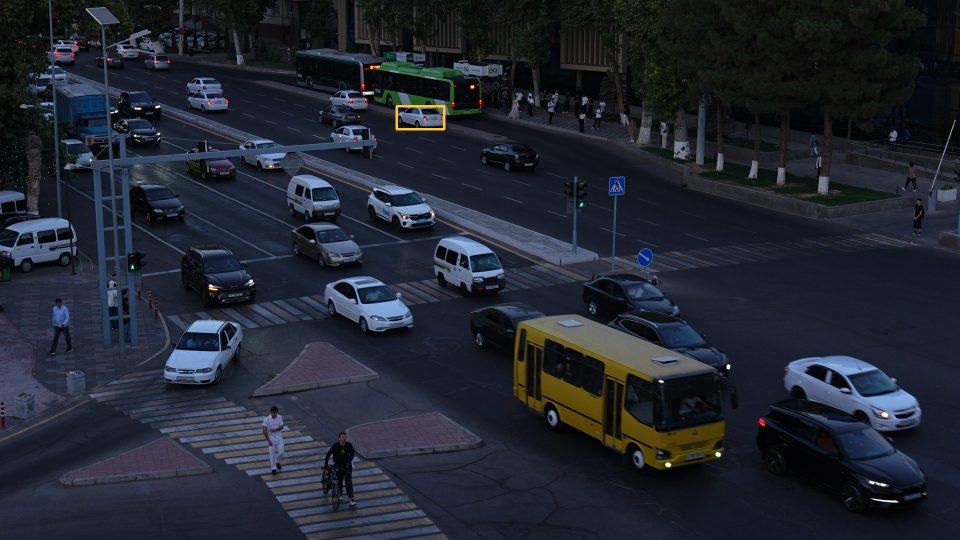 Stopped vehicleC3905 at 0:00.0NB lane
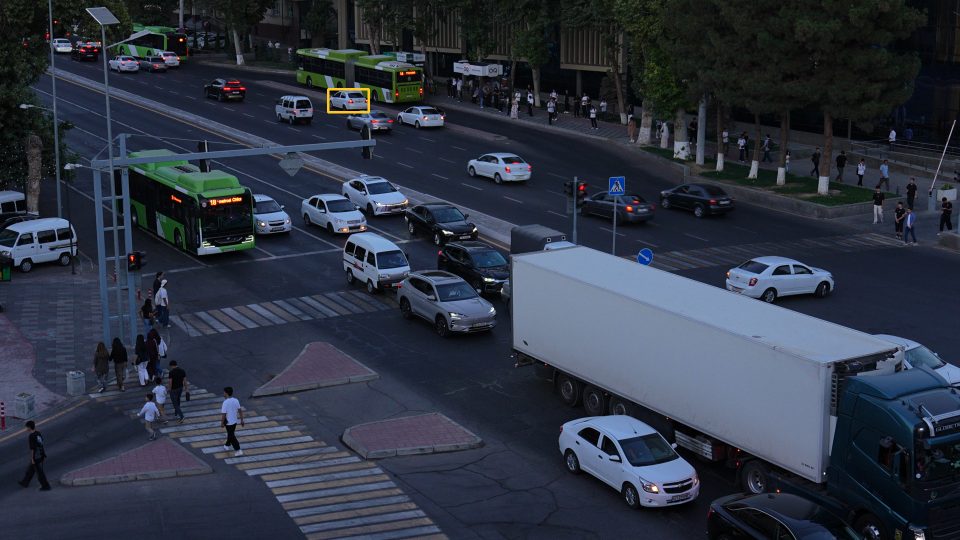 Stopped vehicleC3905 at 0:30.4NB lane
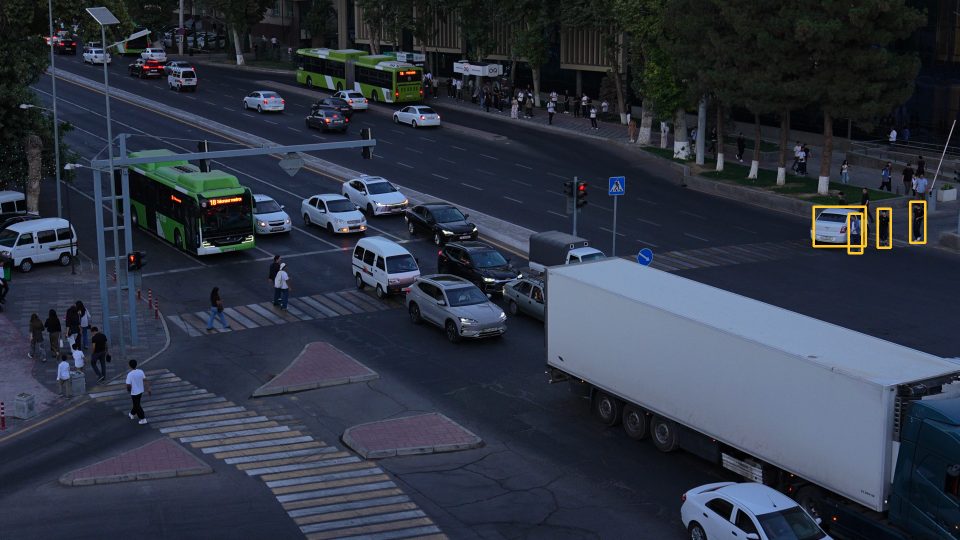 Failure to yieldC3905 at 1:20.6north crossing, NB half
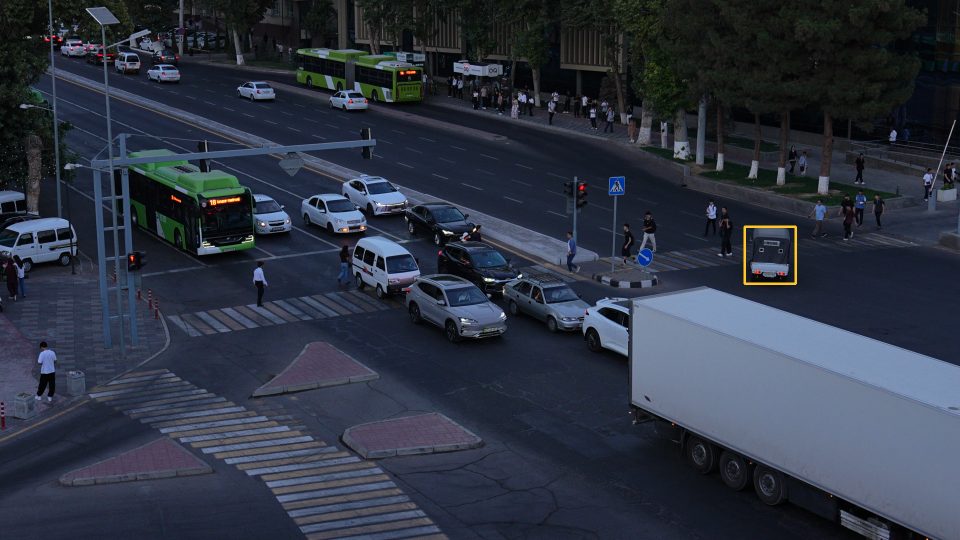 Illegal U-turnC3905 at 1:20.9U-turn round the median nose
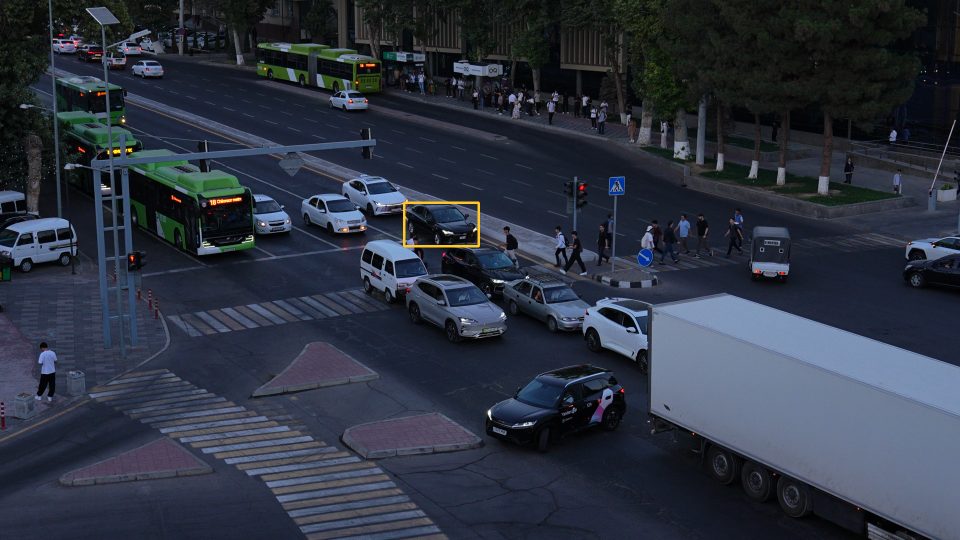 Stop lineC3905 at 1:15.5near the stop line
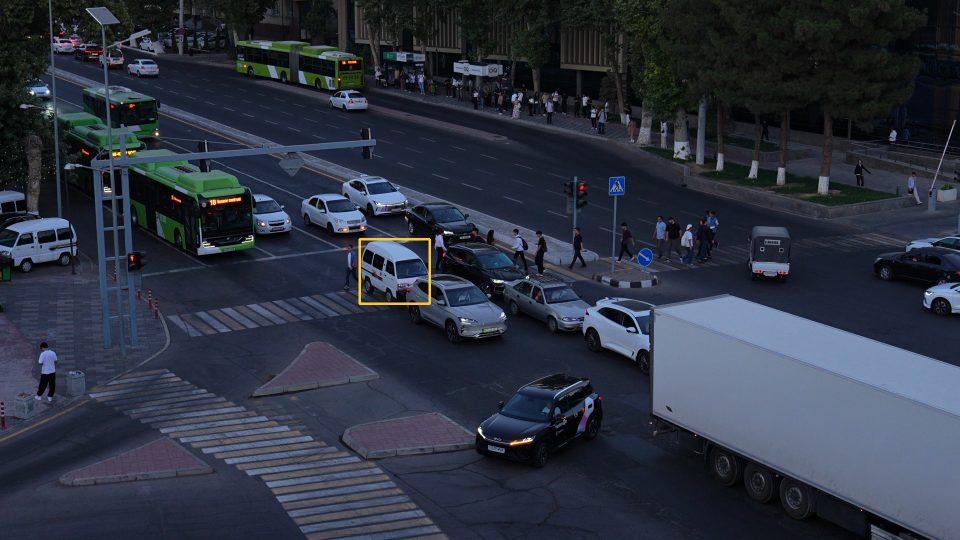 Stop lineC3905 at 1:17.4near the stop line
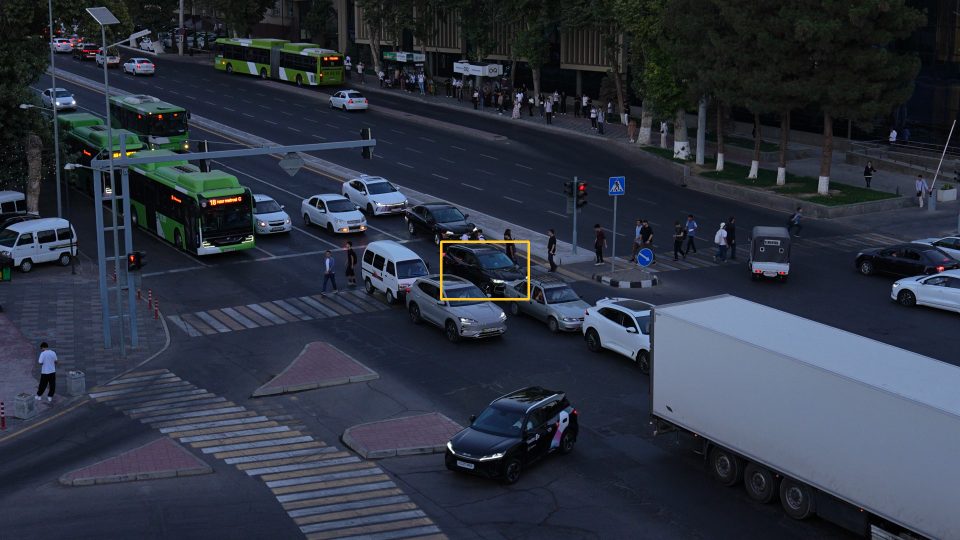 Stop lineC3905 at 1:18.9near the stop line
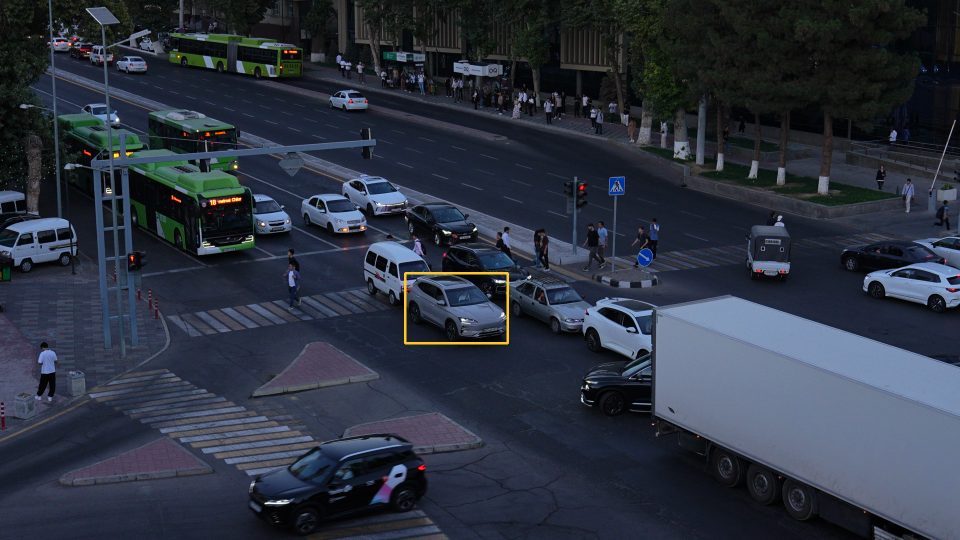 Stopped vehicleC3905 at 1:19.9junction box
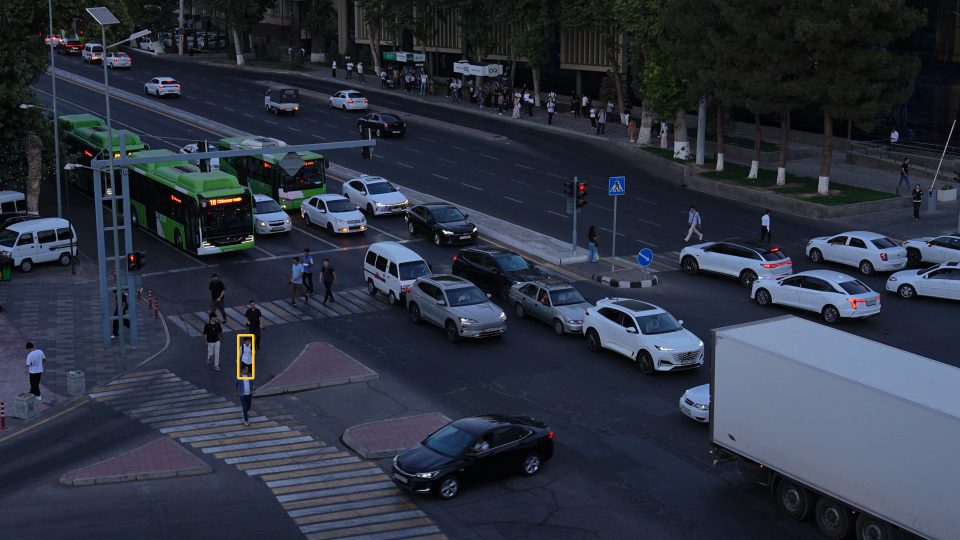 JaywalkingC3905 at 1:44.0near the west crossing
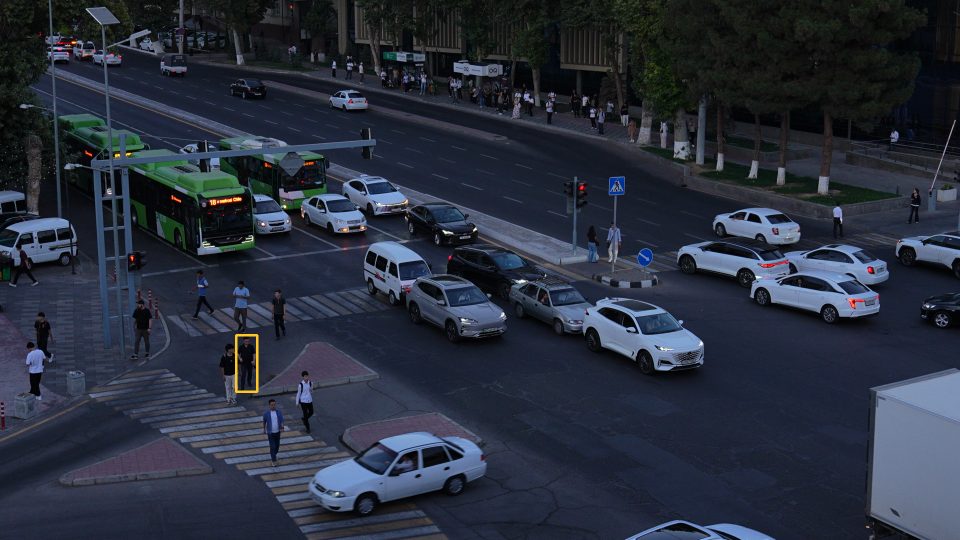 JaywalkingC3905 at 1:46.7near the west crossing
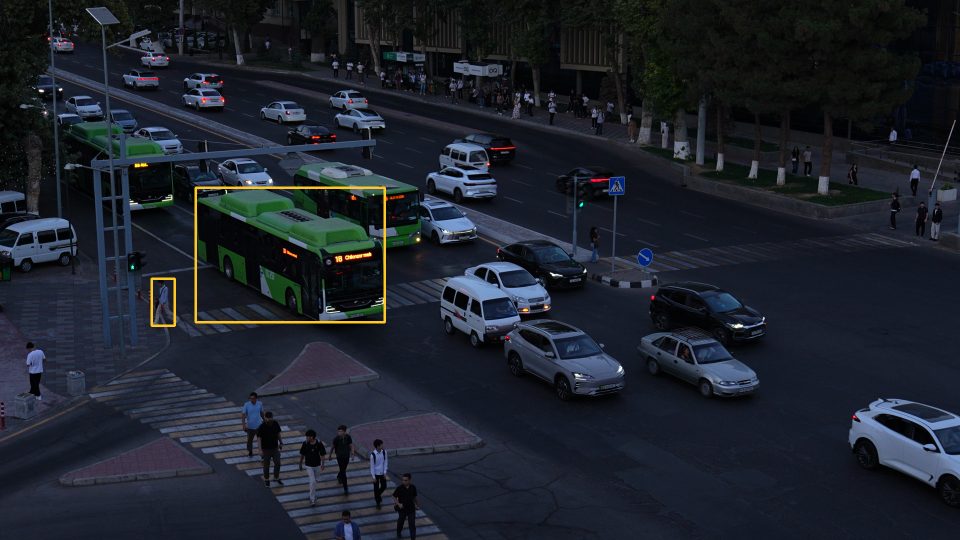 Failure to yieldC3905 at 1:58.6north crossing, SB half
Where it goes wrong
Cases we found by comparing predictions with our labels. They are in the table and on the timeline above too.
- false positiveJaywalking, C3897 at 2:51.3
A delivery rider on a moped slows down and puts a foot on the road to let a car pass. The detector loses the moped for those frames, and at that moment the rider is too slow for our speed test to flag him as a rider, so he counts as a pedestrian standing in the junction box.
Open at 2:51.3 - false positiveFailure to yield, C3905 at 1:08.8
Two men wait at the kerb end of the zebra for their walk phase while a car with a green light drives past them. One of them stands on the end of the stripes and, for 0.7 s, passes both our kerb margin and our walking test, so the rule counts him as out on the crossing.
Open at 1:08.8 - disputedStop line, C3897 at 0:58.8
Cars in the median lane crossed the line on green, then waited about 20 s behind a car turning at the median nose. When the light went red they were still past the line, and the rule called it a stop-line violation. Our labels say it is not one; the task's definition could be read either way.
Open at 0:58.8 - missedRed light, C3905 at 0:33.6
A scooter creeps over the stop line about 0.9 s before green, while the red and amber lamps are lit together. Our lamp reader calls red plus amber 'yellow', and the rule also ignores crossings less than 1.5 s before green, so it never counts this one.
Open at 0:33.6 - missedCongestion, C3896 at 2:06.5
The southbound junction box fills up and jams through a whole green, but the jam crawls at 1 to 2 m/s instead of standing still. The rule only counts vehicles that stand, so it never sees 8 of them on green.
Open at 2:06.5 - missedJaywalking, C3897 at 4:13.0
A man walks up the road beside the west zebra, coming in at the bottom edge of the frame. While his feet are below the frame his foot point sits on the image edge, outside the area the rule checks, so it sees only 0.6 s of him off the crossing and needs 1 s.
Open at 4:13.0
Ablations
Same rules, same dev labels, one change per row. Score A is the official number; it also averages in the zeros for U-turns and illegal turns, which our labels have and no variant predicts. "Emitted" is the mean F1 over the classes we emit, and the last columns give each class's mean F1 over IoU 0.3, 0.5 and 0.7. Detector variants could only be scored on the two clips we cached their detections for, so they come with the submitted configuration scored on the same two clips. Cost is detector compute (model size, input pixels and frames) relative to the submitted configuration. The ablations re-track cached detections, so the first row differs slightly from the official run above: Score A 0.524 against 0.523, and jaywalking 0.551 against 0.538.
On those two clips the smaller detectors score 0.323 to 0.351 against 0.339 for YOLO26m, a difference within the noise of two clips, so the table gives no measured reason to prefer either. We kept YOLO26m because the rules were tuned on its detections, the only ones we cached for all four clips, and because decoding the 4K files, not the detector, sets our run time (see the Approach page).
| Configuration | Clips | Score A | Emitted | Cost | RED | SV | JAY | FTY | STOP | CONG |
|---|---|---|---|---|---|---|---|---|---|---|
| YOLO26m @1280, 10 fpssubmittedSubmitted configuration. | 4 | 0.524 | 0.699 | 1.00x | 0.667 | 0.905 | 0.551 | 0.504 | 0.769 | 0.800 |
| YOLO26m @1280, 5 fpsEvery 6th frame: half the detector work. | 4 | 0.509 | 0.679 | 0.50x | 0.667 | 0.905 | 0.520 | 0.413 | 0.769 | 0.800 |
| YOLO26m @1280, 3.3 fpsEvery 9th frame: a third of the detector work. | 4 | 0.403 | 0.538 | 0.33x | 0.000 | 0.905 | 0.453 | 0.299 | 0.769 | 0.800 |
| YOLO26m @1280, 10 fps, same clipsBaseline for the row below. | 2 | 0.339 | 0.475 | 1.00x | 0.000 | 0.833 | 0.464 | 0.411 | 0.667 | - |
| YOLO26s @1280, 10 fpsSmaller detector (the Part B one), same input size. | 2 | 0.343 | 0.481 | 0.31x | 0.000 | 0.833 | 0.500 | 0.403 | 0.667 | - |
| YOLO26m @960, 10 fpsSame detector, 960 px input: people near the top of the frame shrink to about 17 px. | 2 | 0.333 | 0.467 | 0.56x | 0.000 | 0.833 | 0.424 | 0.409 | 0.667 | - |
| YOLO26n @960, 5 fpsThe live demo's detector and frame rate (it runs in the visitor's browser). | 2 | 0.323 | 0.452 | 0.03x | 0.000 | 0.833 | 0.361 | 0.400 | 0.667 | - |
| YOLO26s @960, 5 fpsThe Part B detector at the demo's frame rate. | 2 | 0.351 | 0.491 | 0.09x | 0.000 | 0.833 | 0.485 | 0.472 | 0.667 | - |
| No registrationScene polygons used as drawn, without mapping each clip onto the reference view. | 4 | 0.391 | 0.502 | 1.00x | 0.400 | 0.905 | 0.449 | 0.343 | 0.619 | 0.800 |
| Hand-drawn road maskJaywalking checked against the traced carriageway instead of the drivable area learned from vehicle tracks. | 4 | 0.507 | 0.677 | 1.00x | 0.667 | 0.905 | 0.415 | 0.504 | 0.769 | 0.800 |
Class columns: RED red light, SV stopped vehicle, JAY jaywalking, FTY failure to yield, STOP stop line, CONG congestion. A dash means the class is in neither the labels nor the predictions of those clips.