Exploratory analysis
What is in the footage
Four clips from one camera on 18 September 2026, from late morning to dusk. Before writing any rule we looked at who uses the junction, when, and where they actually walk and drive.
The clips
| Clip | Local time | Brightness | Light | Resolution | fps | Length | Bitrate | Our labels |
|---|---|---|---|---|---|---|---|---|
| C3896 | 2026-09-18 11:18:24 | 94 | midday sun, hard shadows | 3840x2160 | 29.97 | 5:40.3 | 140 Mbit/s | 25 |
| C3897 | 2026-09-18 11:24:47 | 94 | midday sun, hard shadows | 3840x2160 | 29.97 | 5:17.8 | 140 Mbit/s | 30 |
| C3902 | 2026-09-18 16:58:18 | 65 | low sun, long shadows | 3840x2160 | 29.97 | 5:17.8 | 140 Mbit/s | 27 |
| C3905 | 2026-09-18 17:22:21 | 43 | dusk, underexposed, headlights on | 3840x2160 | 29.97 | 2:07.6 | 140 Mbit/s | 16 |
Brightness is the mean grey level (0 to 255) of frames sampled every 10 s. All clips are h264 High 4:2:2, yuv422p10le.
Road users over time
Distinct tracked road users per 5 s, by class, from our tracks. Click a class in the legend to hide it; hover or tap the chart for values.
Traffic by time of day
How many vehicles are in view at once, split into moving and standing (40 px/s), and how many people the detector sees, as the mean per frame over each clip. Below, the same per 5 s. The standing count rises and falls with the red phase.
Signal plans
From our reader of the three-lamp head on the median nose, measured from one phase change to the next over complete phases. Green includes its flashing end. The afternoon plan lights yellow together with red for the last 3 s of red; that counts as red here.
75 s cycle C3896, C3897
80 s cycle C3902, C3905
| Clip | Full cycles | Green | Yellow | Red | Cycle | Unreadable |
|---|---|---|---|---|---|---|
| C3896 11:18:24 | 4 | 36.0 s | 3.0 s | 36.1 s | 75.0 s | 0.0 s |
| C3897 11:24:47 | 3 | 36.0 s | 3.0 s | 36.0 s | 75.1 s | 0.0 s |
| C3902 16:58:18 | 3 | 38.0 s | 3.0 s | 39.0 s | 80.1 s | 10.6 s |
| C3905 17:22:21 | 1 | 37.9 s | 3.0 s | 39.0 s | 79.9 s | 0.0 s |
Where pedestrians are
Every tracked pedestrian position in the four clips (10 per second per person), by where the feet are. Riders and people seen through car windows are left out, as in the rules. "On the carriageway" means the area vehicles actually drive on, a margin away from the kerbs.
Events in our dev labels
98 events over 18.4 minutes. How the labels were made is on the report page.
| Class | Events | Clips | Median length | Total |
|---|---|---|---|---|
| Failure to yield | 42 | 4 | 1.7 s | 1:30.2 |
| Jaywalking | 28 | 4 | 10.6 s | 6:48.0 |
| Illegal U-turn | 9 | 4 | 36.4 s | 4:48.1 |
| Stopped vehicle | 7 | 4 | 127.5 s | 17:05.6 |
| Stop line | 5 | 4 | 36.0 s | 2:28.4 |
| Congestion | 3 | 1 | 23.0 s | 1:05.5 |
| Illegal turn | 2 | 2 | 9.7 s | 0:19.3 |
| Red light | 2 | 2 | 19.3 s | 0:38.6 |
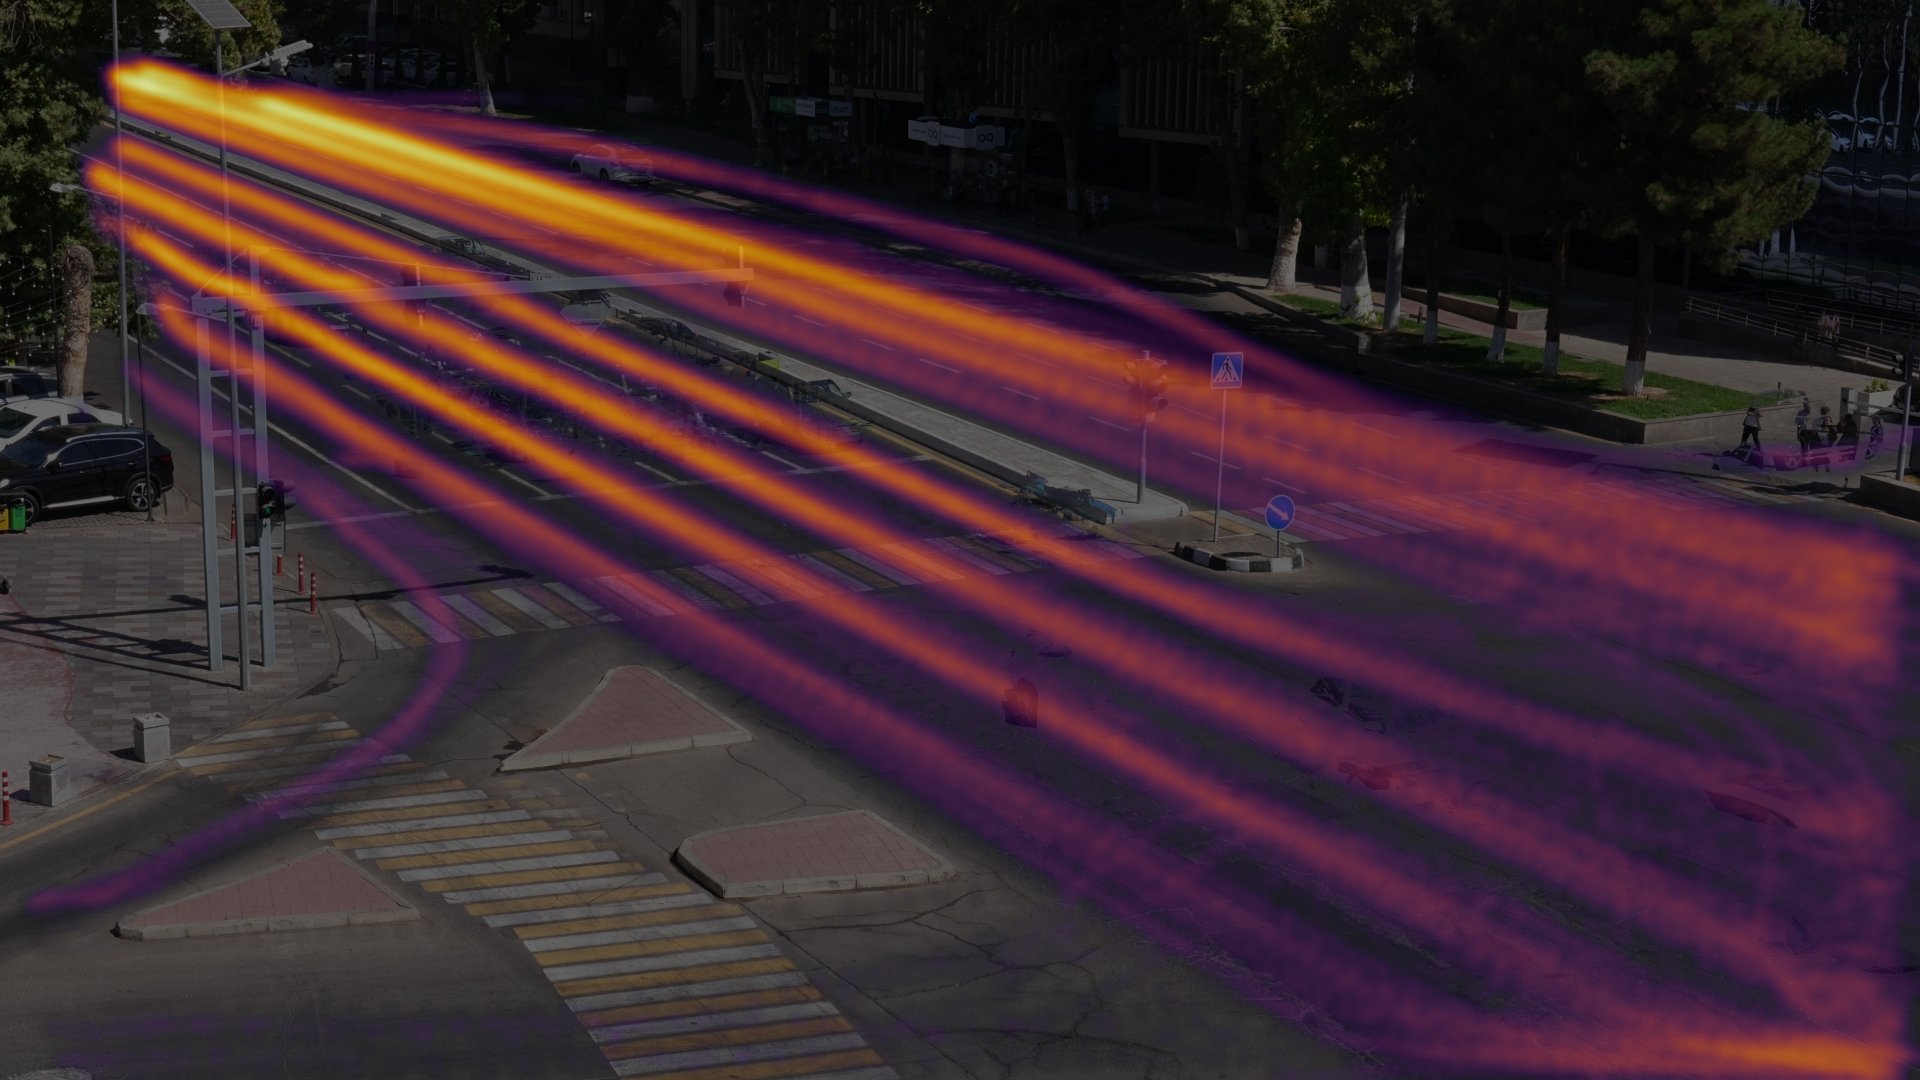
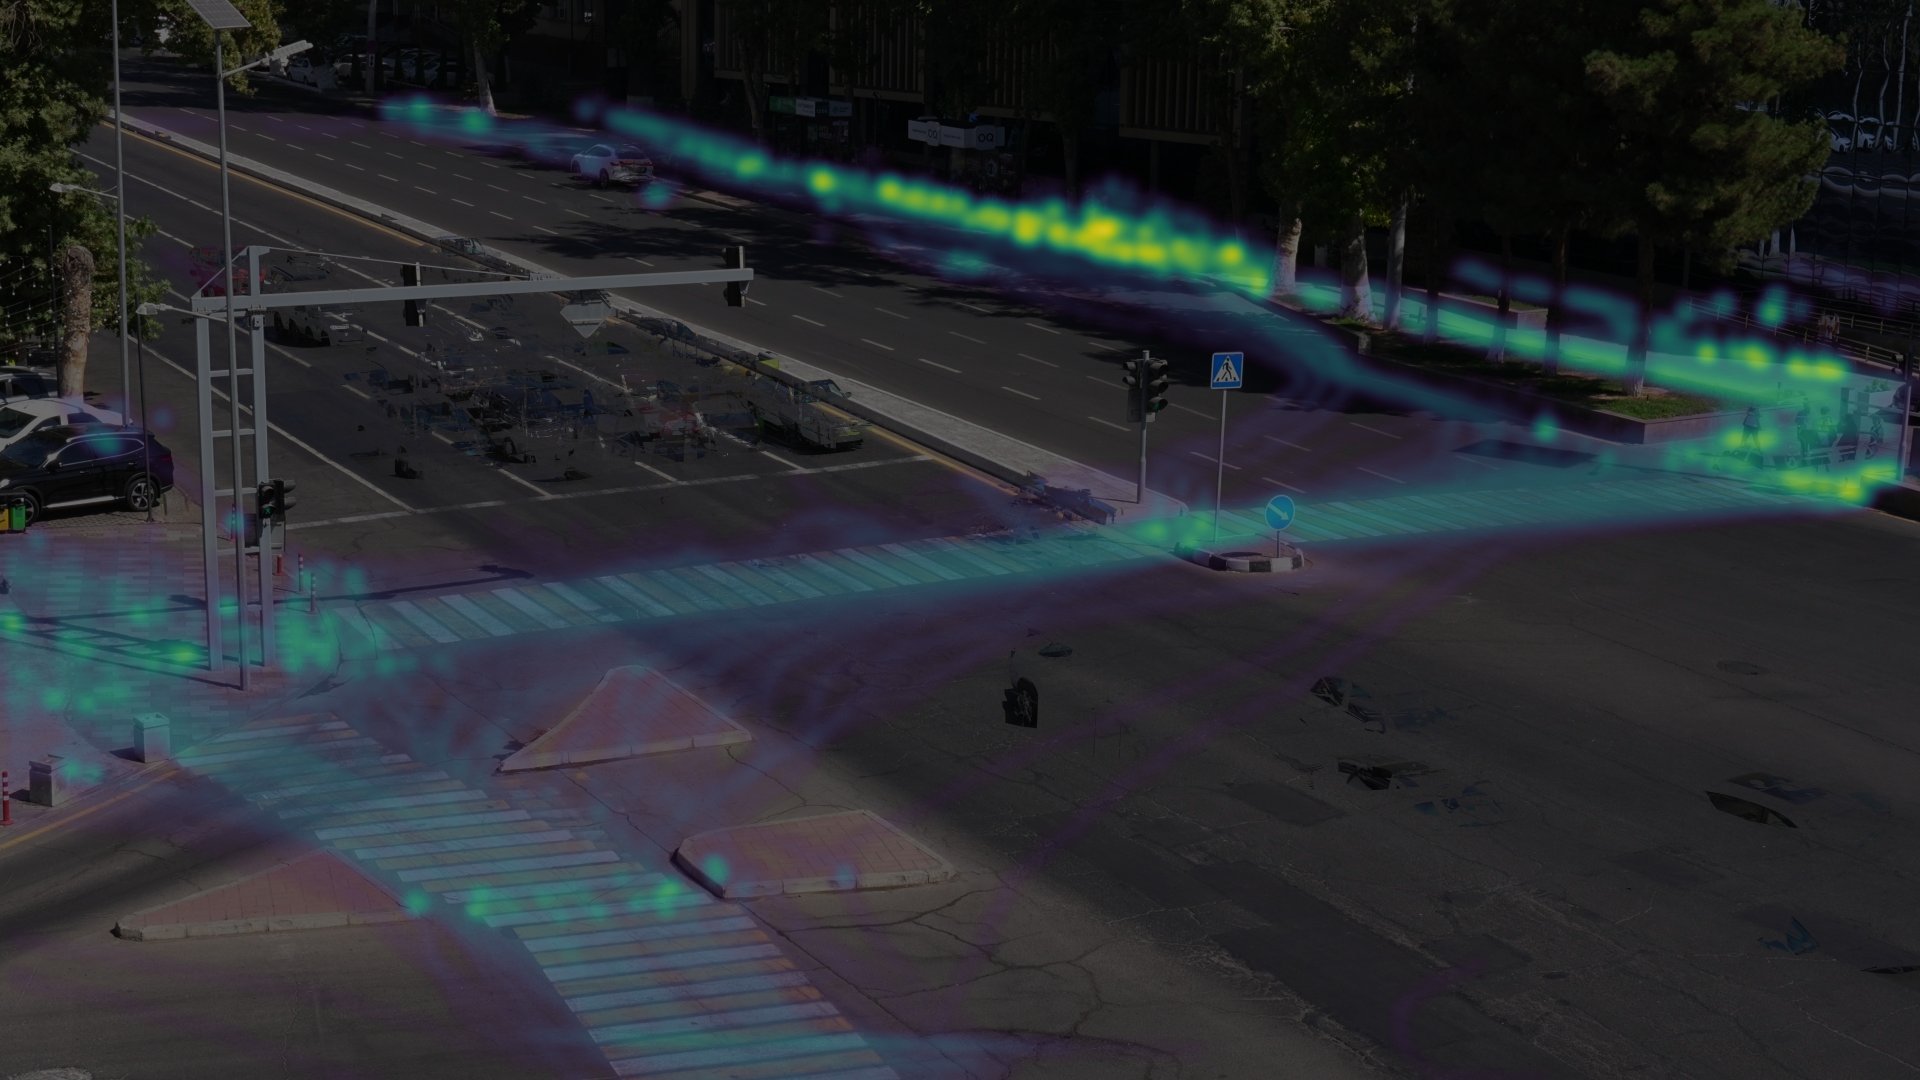
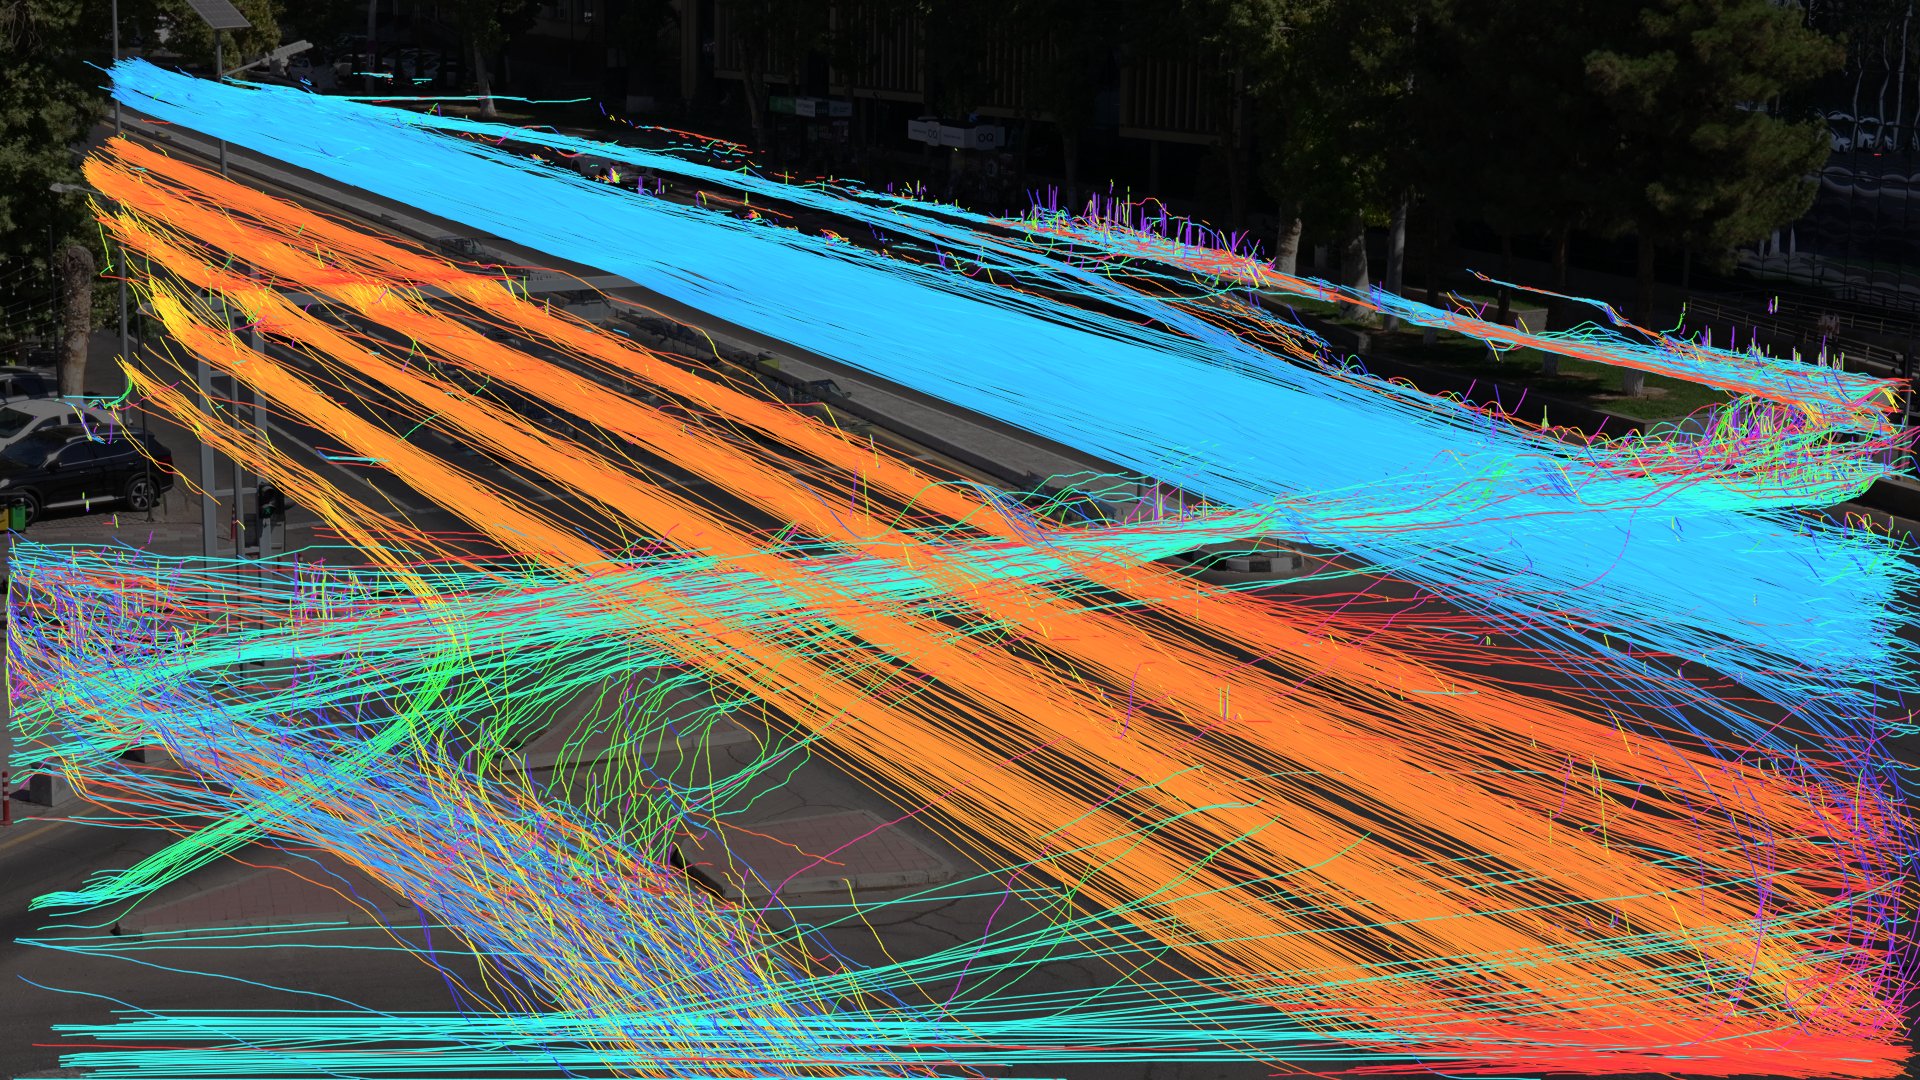
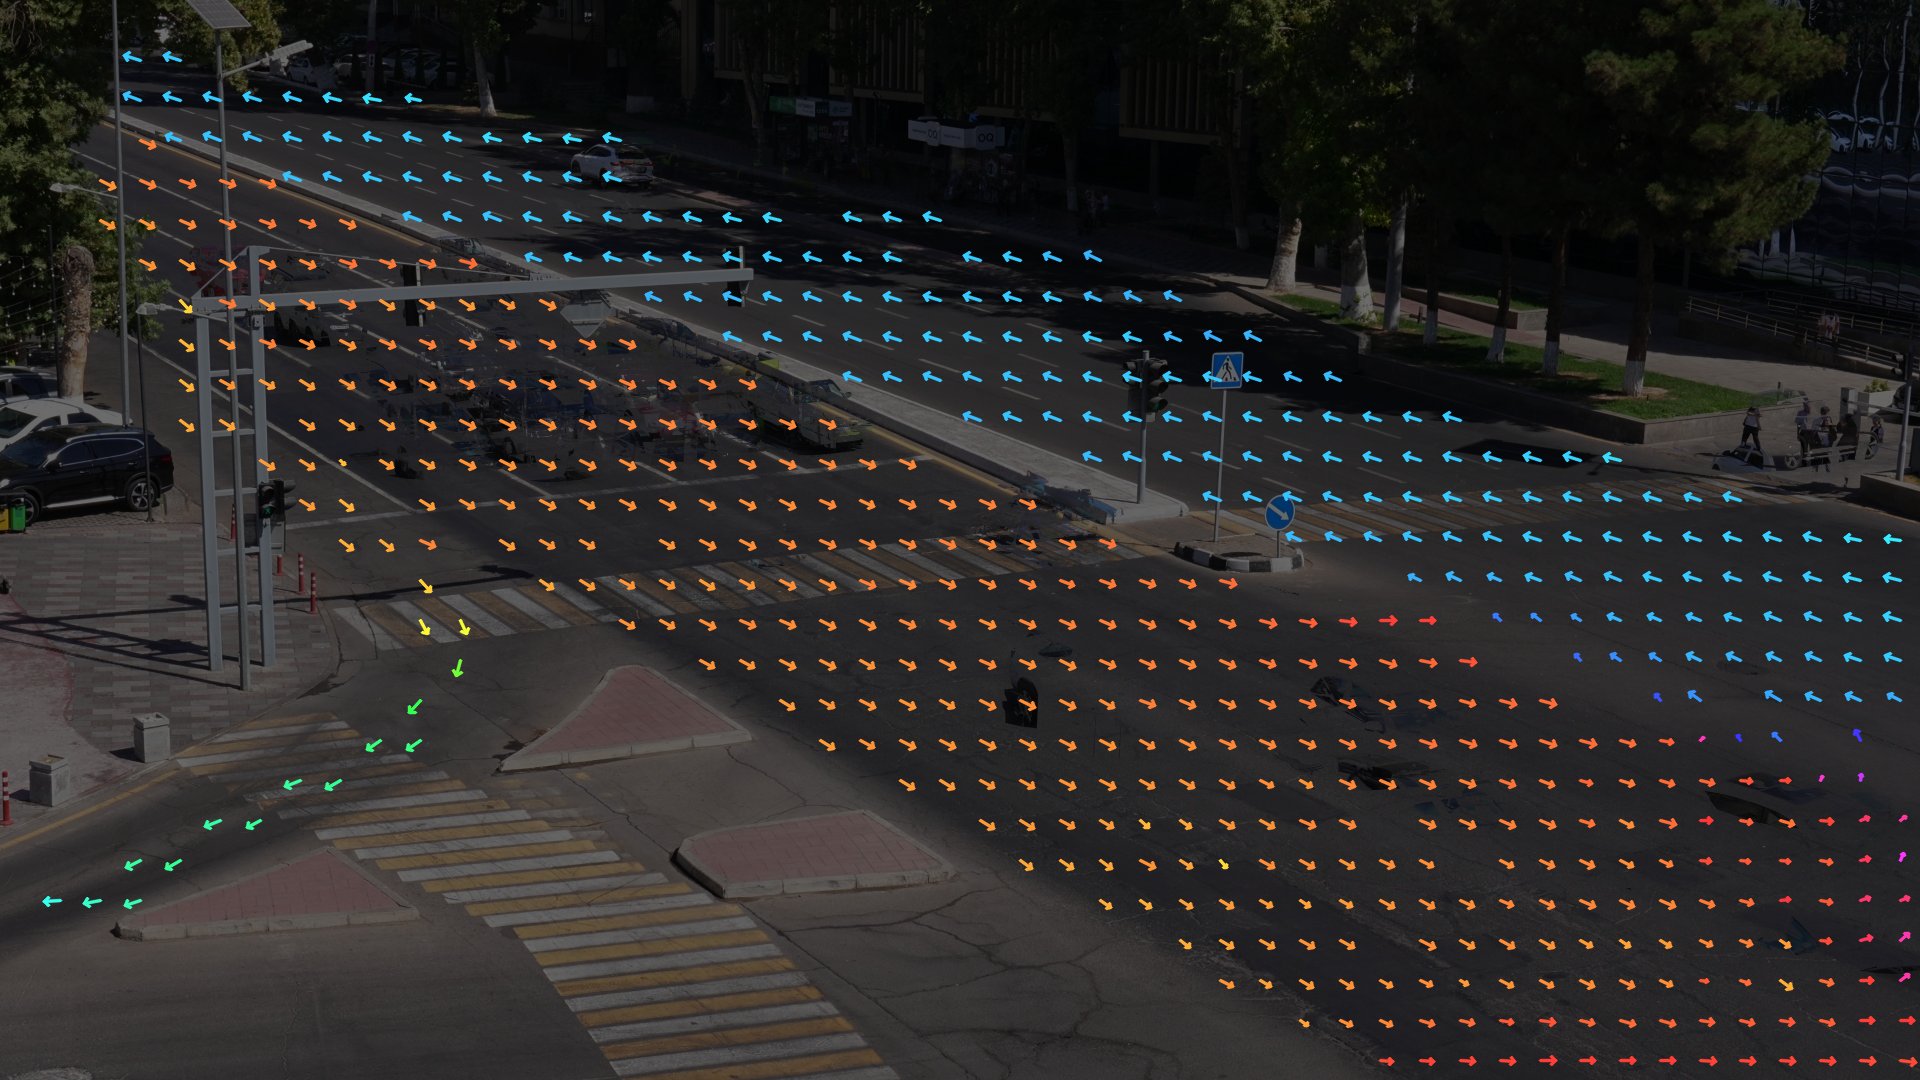
Where things move
All four clips, mapped into the reference view.
What this changed in our solution
- The clips are not framed the same. The afternoon ones are shifted by up to about 60 px and zoomed by 1 to 2% against the morning ones, so every zone is drawn once in a reference view and each clip is registered onto it with a homography.
- The signal plan changes during the day: a cycle of 75 s (36 s green, 3 s yellow, 36 s red) in C3896 and C3897, and 80 s (38 s green, 3 s yellow, 39 s red) in C3902 and C3905. The rules read the phase from the lamps in every sampled frame instead of assuming a timetable.
- The southbound queue stands through every red, 36 to 39 s. So stopped_vehicle ignores the southbound approach, and congestion only counts a queue that still stands 8 s into the green.
- 5.7% of pedestrian positions are on the carriageway outside a zebra, against 21.2% on a zebra. The rest, 73.1%, are on pavements, kerbs, islands and the median, which is where the jaywalking rule must not fire.
- Failure to yield is the most frequent event in our labels and a short one: median 1.7 s from the car entering the zebra to leaving it. At 5 fps that is about 9 frames, and on our labels 5 fps drops failure_to_yield F1 from 0.504 to 0.413 (the FTY column of the ablations on the Results page), which is why Part A samples 10 frames per second.
- The dusk clip is much darker than the midday ones (mean brightness 43 against 94 out of 255), so registration matches every clip against a dusk reference as well as a midday one.